Analyzing the vast amounts of data your business collects isn’t the most enjoyable task. Just thinking about it can be overwhelming!
But, data analysis isn’t optional, particularly for a business that wants to thrive. You must assess customer behavior, revenue, and sales data to understand your market and continuously improve processes for better results.
How do you analyze data without slogging through it for hours and hours? Simple: through data filtering.
Say you have multiple Bitly campaigns running and want to measure their performance. Rather than assessing each link’s clicks for the entire life of your campaign, you can filter performance by date to effectively evaluate your improvements over time.
This article will look at everything you need to know about data filtering.
What is data filtering?
Modern consumers generate unprecedented amounts of data. Every website browse or survey fill-out presents businesses with tons of information that can help them understand consumer behavior. However, assessing all the data can be resource- and time-consuming. That’s where data filtering comes into play.
Data filtering involves examining large data sets, choosing smaller subsets from the larger whole, and using them for viewing or analysis. The process allows businesses to focus on relevant data points, like specific demographics, dates, geographic locations, and so on.
The key benefit of data filtering is that it helps businesses quickly extract relevant insights from large data sets. Think of it as a sieve, only instead of separating solids and liquids, it sifts through data to highlight meaningful insights.
Data filtering enables effective performance analysis, decision-making, marketing refinement, and risk management. For example, if you want to decide on product production during the holiday season, you can filter sales data by time to help forecast demand.
Advantages of data filtering
Is data filtering worth it? Definitely. But don’t take that answer at face value. Take a look at these key benefits of creating small subsets of data.
Better data quality and accuracy
In all honesty, not all data your business collects is usable. Some of it may contain errors, outliers, or even intentional manipulation—like inflating sales figures to make it seem like a sales team is performing better than it really is. All of these issues affect data quality.
Data filtering improves the quality and accuracy of data by removing irrelevant, redundant, or erroneous information. This leads to cleaner data subsets, promoting better analysis and decision-making.
Faster data processing
Filtering unnecessary data can significantly speed up processing times by reducing data volumes. Eliminating irrelevant or erroneous variables gives your data processing algorithms fewer data points to read and analyze, allowing for faster decision-making.
Fast data processing presents numerous benefits for nearly any type of business. For example, an e-commerce store can make real-time adjustments to its inventory levels, product recommendations, and pricing by analyzing purchasing behavior quickly.
Similarly, a finance institution can rapidly identify and block fraud attempts if it detects anomalies in dealings or unauthorized transactions.
Improved focus and relevance
Data filtering lets you focus on the most relevant information for specific tasks or analyses, leading to more targeted and effective decision-making. The more data-driven a strategy is, the higher the likelihood of success.
Say you’re a marketer interested in optimizing your strategy by focusing on areas where your products are popular. Analyzing city-level data is a better way to go than looking at the performance of your links in general, as there’s a narrower focus on location.
You can make well-informed decisions on the demographics to target and where to focus your marketing resources, boosting your chances of realizing a high return on investment.
When should you filter data?
Now that you know the why of data filtering, let’s look at the when. Here are some appropriate times to filter data.
Before data analysis
Did you know only 35% of small businesses reach the ten-year mark? While there are plenty of reasons for business closure, poor decision-making is at the top.
Many business owners don’t take the time to assess and understand their markets before breaking into their desired niches. After all, the process can be quite daunting, as it involves analyzing a lot of data (customer behavior, sales trends, competitors, market gaps, and so on).
Even those who investigate their markets and successfully start their businesses often feel overwhelmed by the many decisions they have to make. In fact, up to 72% of business leaders have given up on decision-making altogether because they’re simply overwhelmed by the sheer volume of data.
To make decision-making easier—whether when starting your business or making day-to-day decisions—you need to filter data. Data filtering streamlines data analysis by eliminating irrelevant and erroneous data.
This leaves you with smaller, cleaner, more manageable, and more accurate data points that can guide decision-making and lead to more reliable analysis results.
During data integration
Businesses rely on numerous data sources for effective decision-making. Take, for example, a retail store owner looking for insights into customer purchasing behavior. They may assess sales reports, give customer surveys, and analyze website browsing trends for a well-rounded snapshot of customer behavior.
The downside to using varying data sources is that there can be a lot of redundancy and inconsistencies in the raw data. Filtering during integration can help create a unified, coherent dataset that you can easily analyze and apply.
When updating datasets
Businesses must regularly update their data to reflect changing customer behavior and market trends. If you run an e-commerce retail store, you need to collect fresh data as your products sell, the market evolves, and customer preferences change so you can update your strategies accordingly.
This means conducting data analyses frequently. Filtering during updates removes outdated or redundant data and maintains the dataset’s relevance and accuracy. This can facilitate easier and more informed decision-making.
In response to data privacy regulations
Data privacy laws are constantly evolving to adapt to new technology. For example, states like California and Colorado have replaced their harm-prevention-based approach to data privacy with a rights-based philosophy. This approach states that individuals own their personal data and can determine who can access and use it.
In light of such changes, businesses must constantly assess and filter out personal or sensitive information from datasets to comply with privacy laws and regulations. Doing so not only ensures you’re on the right side of the law but also minimizes the potential fallout of data breaches.
To tailor reporting and visualization
Can you imagine presenting investors or partners with all the data collected from customer surveys or interviews? The presentation would not only be time-consuming but also downright dull and tedious!
How do you present everything you need to without boring your audience or tiring yourself out? Through data visualization and reports.
For an easier time generating reports and visuals, you need to—you guessed it—filter data. This way, you can ensure you only provide relevant information and communicate effectively with your audience, facilitating better decision-making.
Important data filtering options to know
You can use various techniques to narrow down large data sets based on specific criteria. Some common options include:
- Textual or string filters: Ideal for isolating data based on text content, like locations in customer feedback or product names.
- Numerical filters: Perfect for segmenting data based on numerical values, such as sales data or financial metrics.
- Date and time filters: Suitable for narrowing down data based on dates and times, such as customer activity within a specified time frame.
- Categorical filters: Appropriate for filtering data based on specific categories, such as age group, geographic location, and gender.
- Custom filters: Ideal for cases where you need to define your own criteria to meet specific requirements—for example, transactions with cost prices exceeding a certain amount.
- SQL (Structured Query Language) filters: Suitable when retrieving data from database management systems (DBMS). Examples include customers in a specific location, transactions within a specific time period, and so on.
- Excel filters: As you can already guess, they’re perfect for the advanced filtering of data like sales records and customer feedback on Excel. You can refine your search criteria as much as you need through the program’s intuitive drop-down menu.
How Bitly can help you implement data filtering into your workflow
With Bitly, you never have to worry about overwhelming data sets, thanks to two of the platform’s popular features: data filtering and data export. Here’s how each one can help you implement data filtering into your workflow.
Data filtering
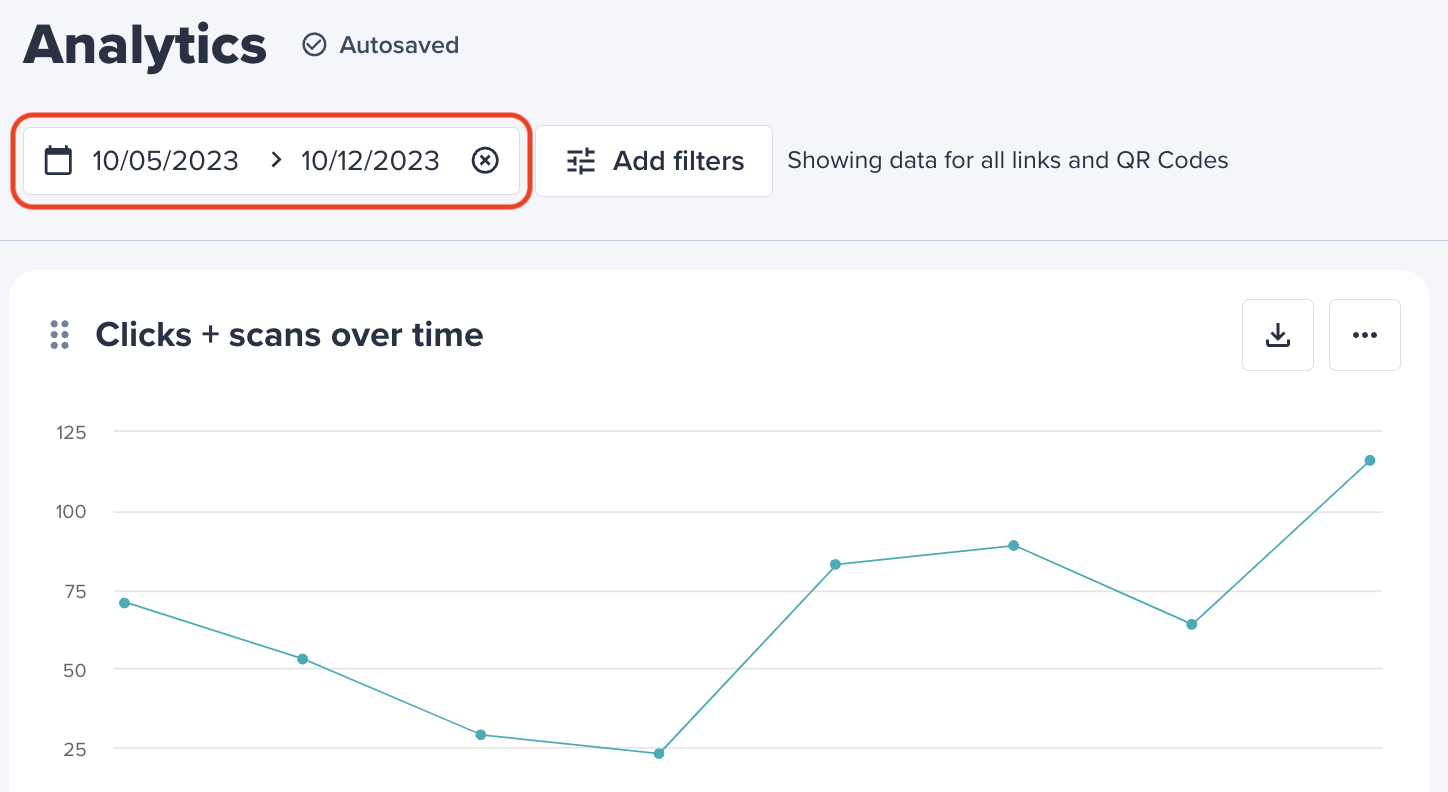
Bitly offers a wide range of click tracking data—from the total number of clicks a link receives to click locations and devices—giving in-depth insights into campaign performance. To facilitate easier data analysis, the platform allows customers to filter data based on date ranges by simply following the steps below:
- Log into your Bitly account.
- Tap Analytics on the left sidebar.
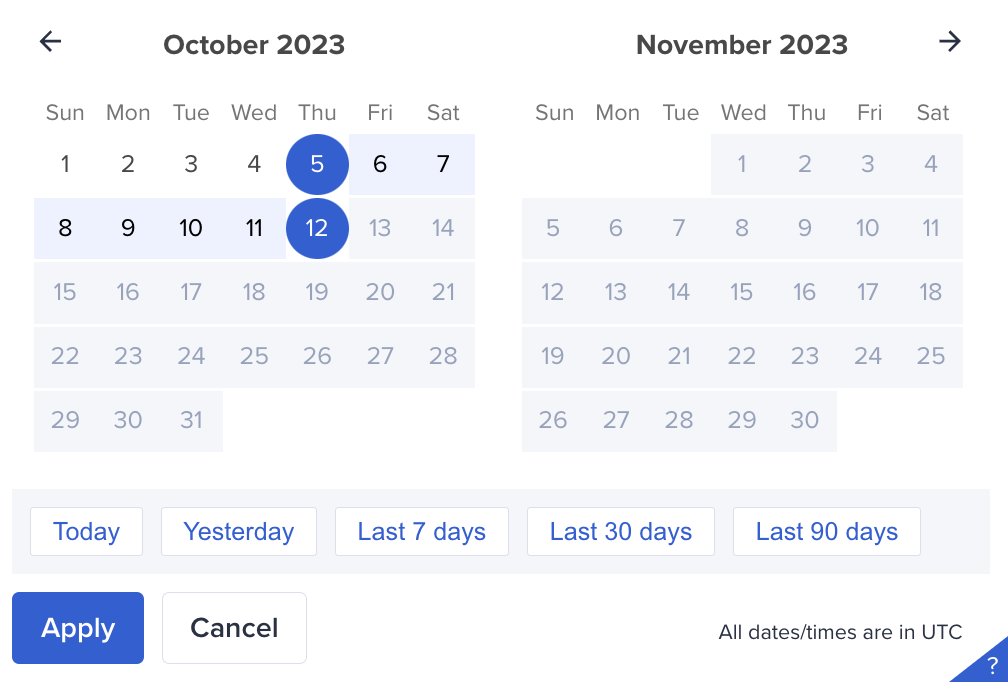
- Tap the date selector.
- Select a preset time period or enter a custom date range.
- Tap Apply.
With an Enterprise Plan, you can also:
- Filter Analytics metrics to any range within the past 90 days to see things like total clicks, unique clicks, and top content.
- Adjust date ranges of top-performing locations or referrers for any time over the past 90 days so you can easily visualize trends over the last quarter.
- Analyze link data from any time period—check out click and scan data history up to two years or look at your all-time best content or product pages.
By filtering link performance by date, you can analyze campaign performance over specific periods or understand trends in link activity. This can facilitate more targeted insights and better decision-making.
Say you run an online ecommerce store with fluctuating sales throughout the year. By filtering performance by date, you can identify your most popular sales months or weeks and adjust inventory levels as needed.
Data exporting
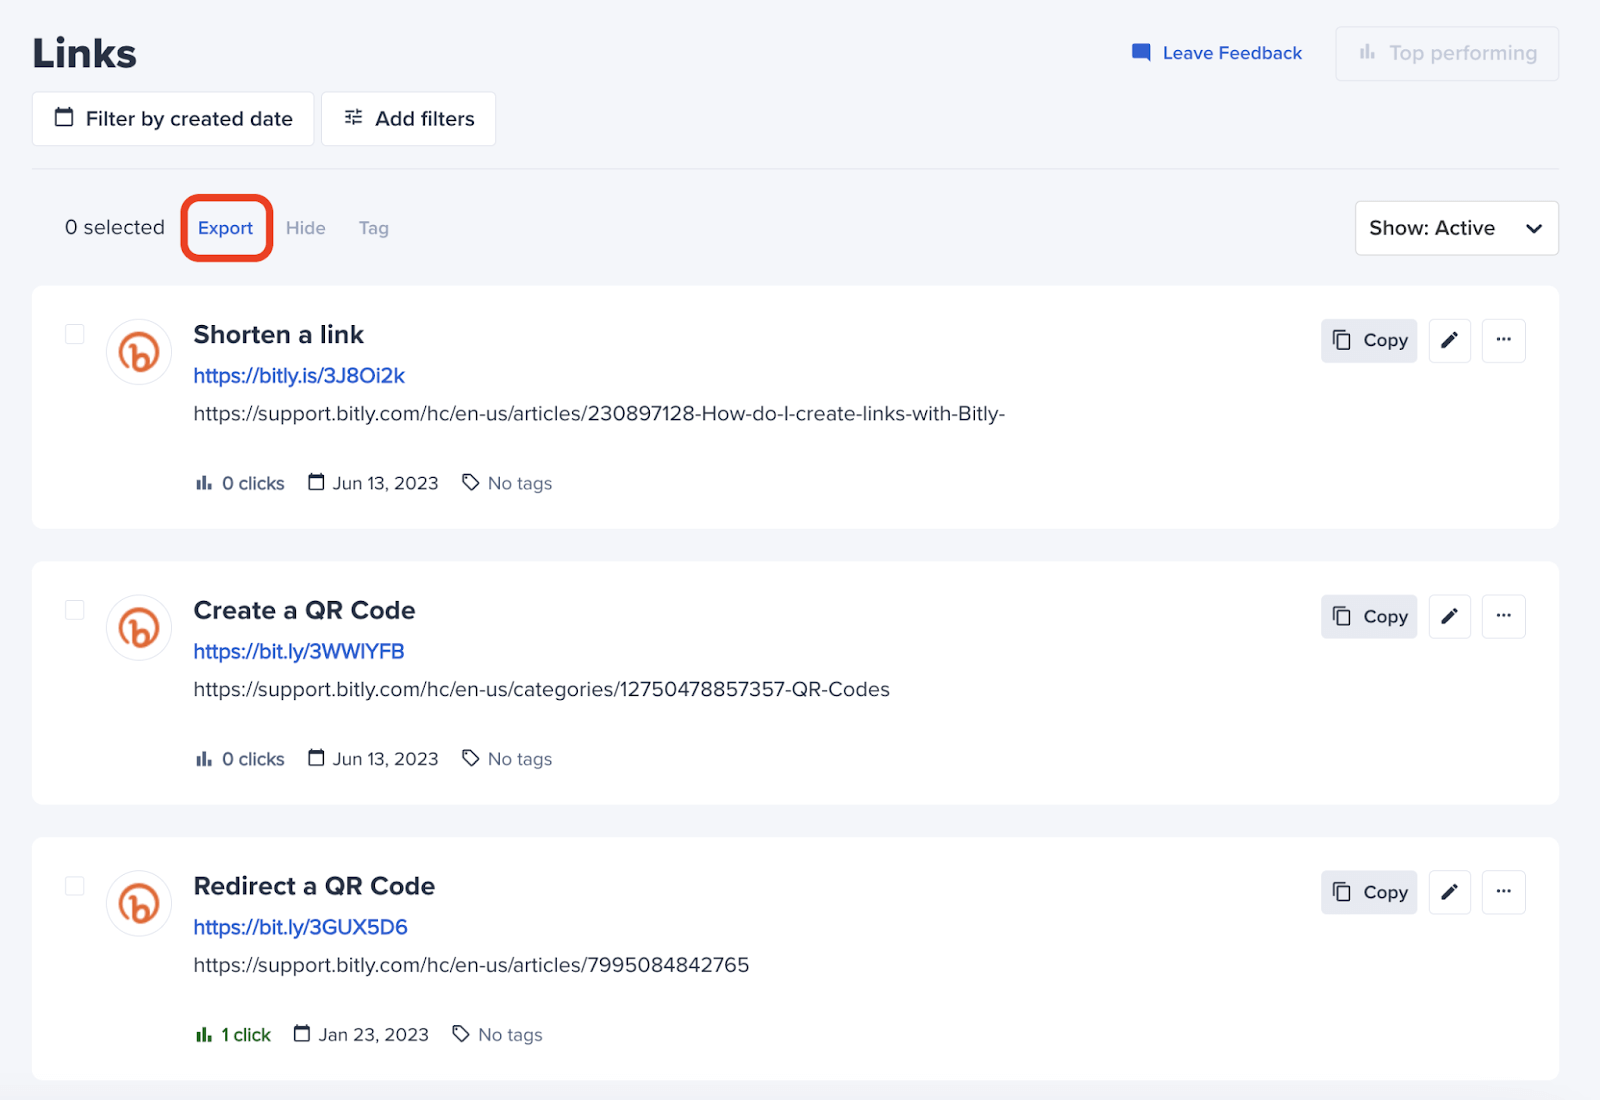
Convenience doesn’t end at data filtering, thanks to Bitly’s data export capabilities. If you have a Premium or Enterprise Plan, you can export link data from the Links page for further analysis using your preferred tools. When you do, Bitly will deliver a CSV file to your email containing data fields like link titles, dates created, and number of clicks.
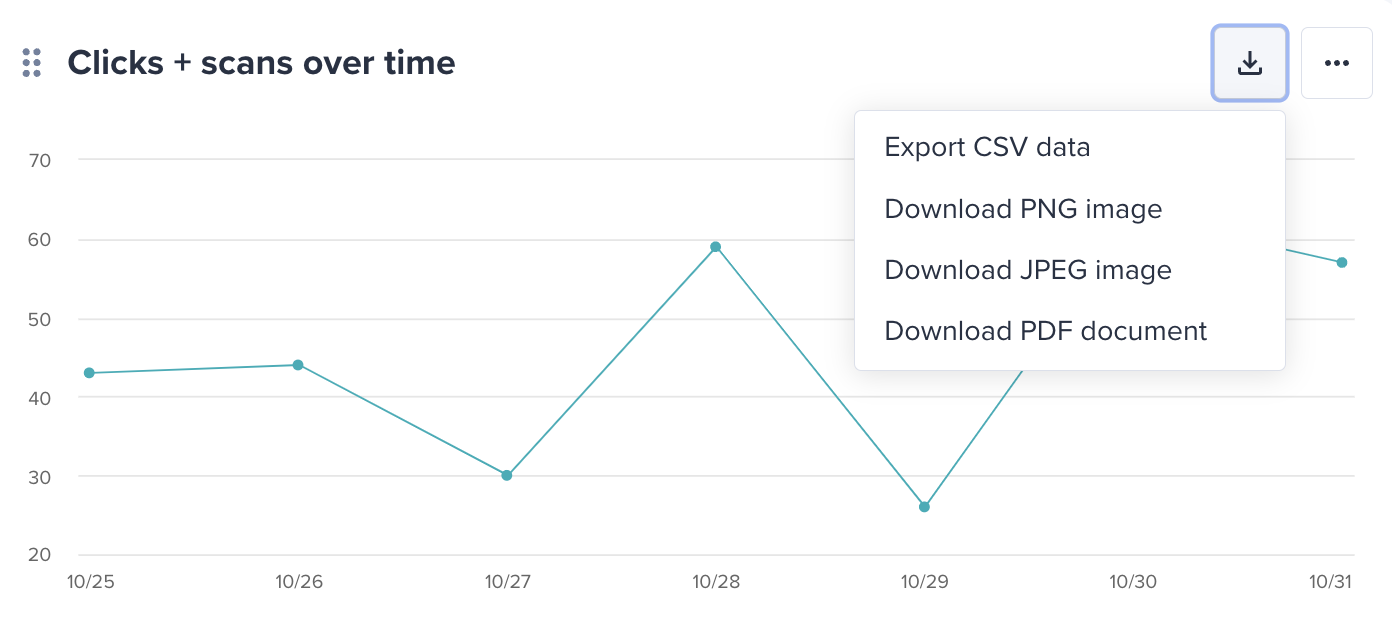
Alternatively, you can export click data from the Analytics page by logging into your account, tapping Analytics, and filtering data by date or link. Then, you can export the report as a CSV file or image, depending on your preferences. You can export:
- Top-line metrics of total clicks
- Referral sources or locations
- All the data from your Bitly links, for any data range—filter by tag, single link, campaign, title, and export with a click
- Top performing links—quickly pull insights on the topics and channels that best engage your audience
- With peace of mind—exports only go to verified email addresses
Exporting filtered link data can help you integrate Bitly data with other data sources, such as Google Analytics. This enables comprehensive cross-platform analysis and deeper insights into customer behavior and campaign performance.
For example, by integrating Bitly and Google Analytics data, you gain insights into click performance, engagement, and bounce rates. With this information, you can develop effective strategies to improve engagement.
Make better business decisions with filtered data
Data analysis doesn’t have to be a nightmare. Rather than scroll through endless data reports, filter data by relevant criteria for quicker and easier analysis. Not only will this save your sanity—it can also result in better decision-making and operational efficiency.
With Bitly’s data filtering and data export features, you can get a more manageable and clearer visual of your campaigns’ performance.
Whether you’re a business owner looking for insights into your links’ performance or a marketer interested in integrating Bitly data with other tools, you’ve found the perfect ally in the Bitly Connections Platform.
Sign up for Bitly today for better data filtering and faster decision-making.