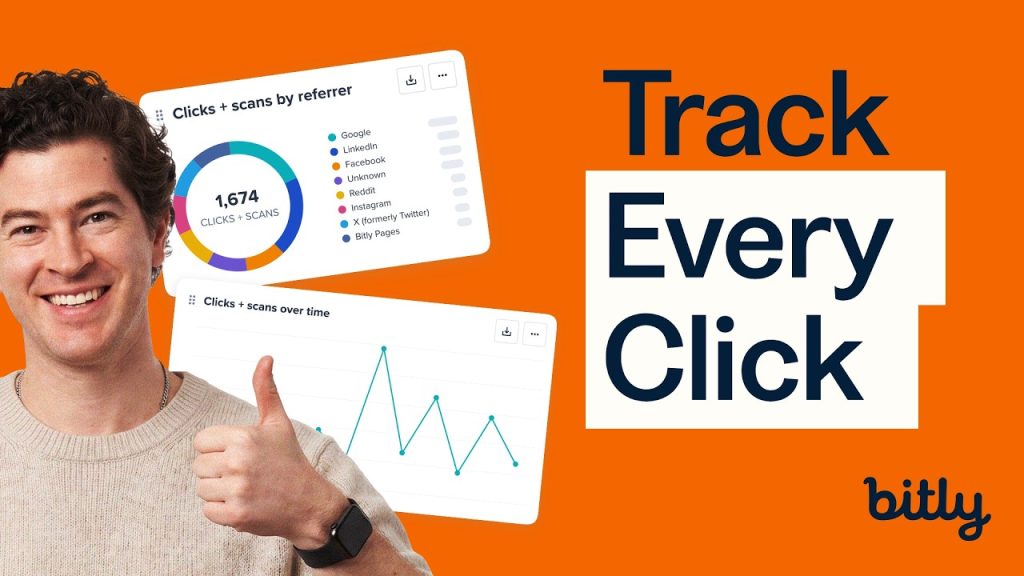

Learn how to use Bitly Analytics to track link clicks, QR Code scans, referrers, and location data—all in a fully customizable analytics dashboard built for marketers.
Chapters
- 0:00 Intro to Bitly Analytics
- 0:30 Overview of analytics modules
- 0:51 How to customize a module
- 1:20 Moving and managing modules
- 1:45 Filtering by campaign
- 2:08 Customizing dashboard
- 2:27 Exporting data and CSV downloads
- 2:49 Reviewing what downloads look like
- 3:05 What’s coming next
Bitly Analytics gives marketers full visibility into how their Bitly Links and Bitly Codes are performing. The analytics dashboard is made up of modules—customizable widgets that display data like performance over time, top referrers, location breakdowns, and top-performing links and QR Codes.
Each module can be edited to show different data types and visualizations. Switch between a line chart and bar chart, adjust the time period, and save your preferred view—all in a few clicks. You can also filter the entire dashboard to a specific campaign by searching for links by title, destination URL, or custom back-half, so you’re always looking at the metrics that matter.
When you’re ready to share insights with your team, every module can be exported as an image for presentations, and the underlying data can be downloaded as a CSV for deeper analysis alongside other sources.
- Try Bitly for FREE
- 🚀 https://bitly.is/Right4U
Related videos
- How to Shorten a URL with Your Own Domain Using Bitly 👉 https://bitly.is/shortenURL
- How To Set Up a Custom Short Link in Bitly 👉 https://bitly.is/CustomShortLink