QR Codes have become a familiar part of everyday life, but the way businesses use them is still evolving. In 2026, they’re showing up across more industries, more markets, and more customer touchpoints, while businesses are also putting more thought into how those codes look, where they appear, and what happens after someone scans.
To understand what that looks like in practice, we analyzed 1.9 million QR Codes created across Bitly and QRCG by Bitly in the first half of 2026, looking at everything from scan growth and industry adoption to company size, geography, and customization. Let’s dig into the data!
Trend 1: QR Code scans are on the rise in 2026
From H1 2025 to H1 2026, QR Code scan volume grew 6.2% year over year, showing that QR Codes continue to play a growing role in how people move from physical experiences to digital ones. If you’ve heard the theory that people are tired of scanning, the numbers say otherwise—we broke that down further in The State of QR Code Scans in 2026.
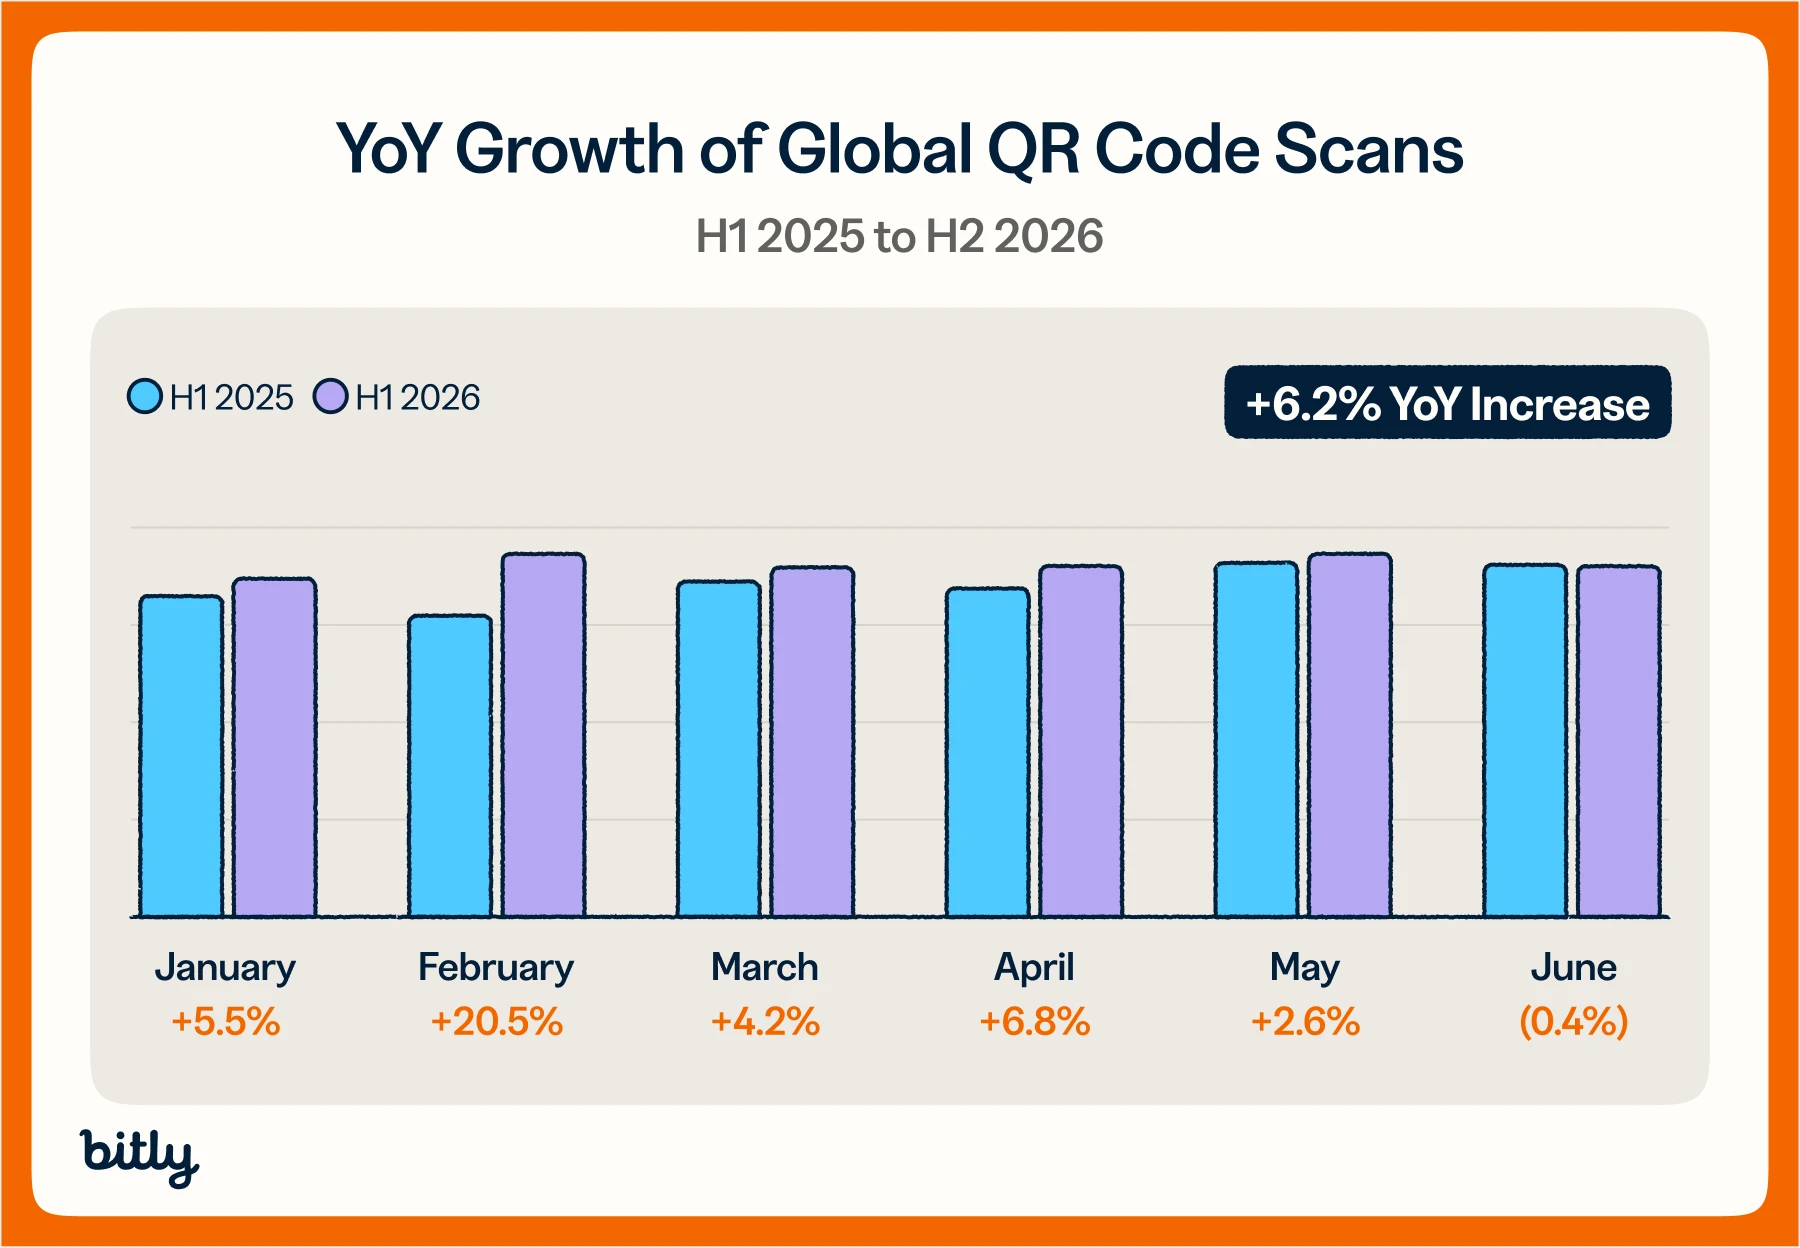
But that growth isn’t happening at the same pace throughout the year. Retail is a good example: year-over-year scan growth reached 43% in April and 38% in May, compared with just 4% in January and February. That kind of variation suggests QR Code engagement can accelerate around particular campaigns, seasons, or customer moments rather than following a steady upward curve. If you’re trying to figure out what your own peaks and valleys mean, our QR engagement metrics article walks through how to read those patterns.
Scan volume also varies significantly by industry. In the Restaurants & Leisure industry, for example, the average QR Code generated nearly 2x more scans per code than the overall average. That variation becomes even clearer when you look industry by industry, where both QR Code creation and scan growth tell very different stories.
Trend 2: Industries making the most QR Codes aren’t always the ones getting the most scans
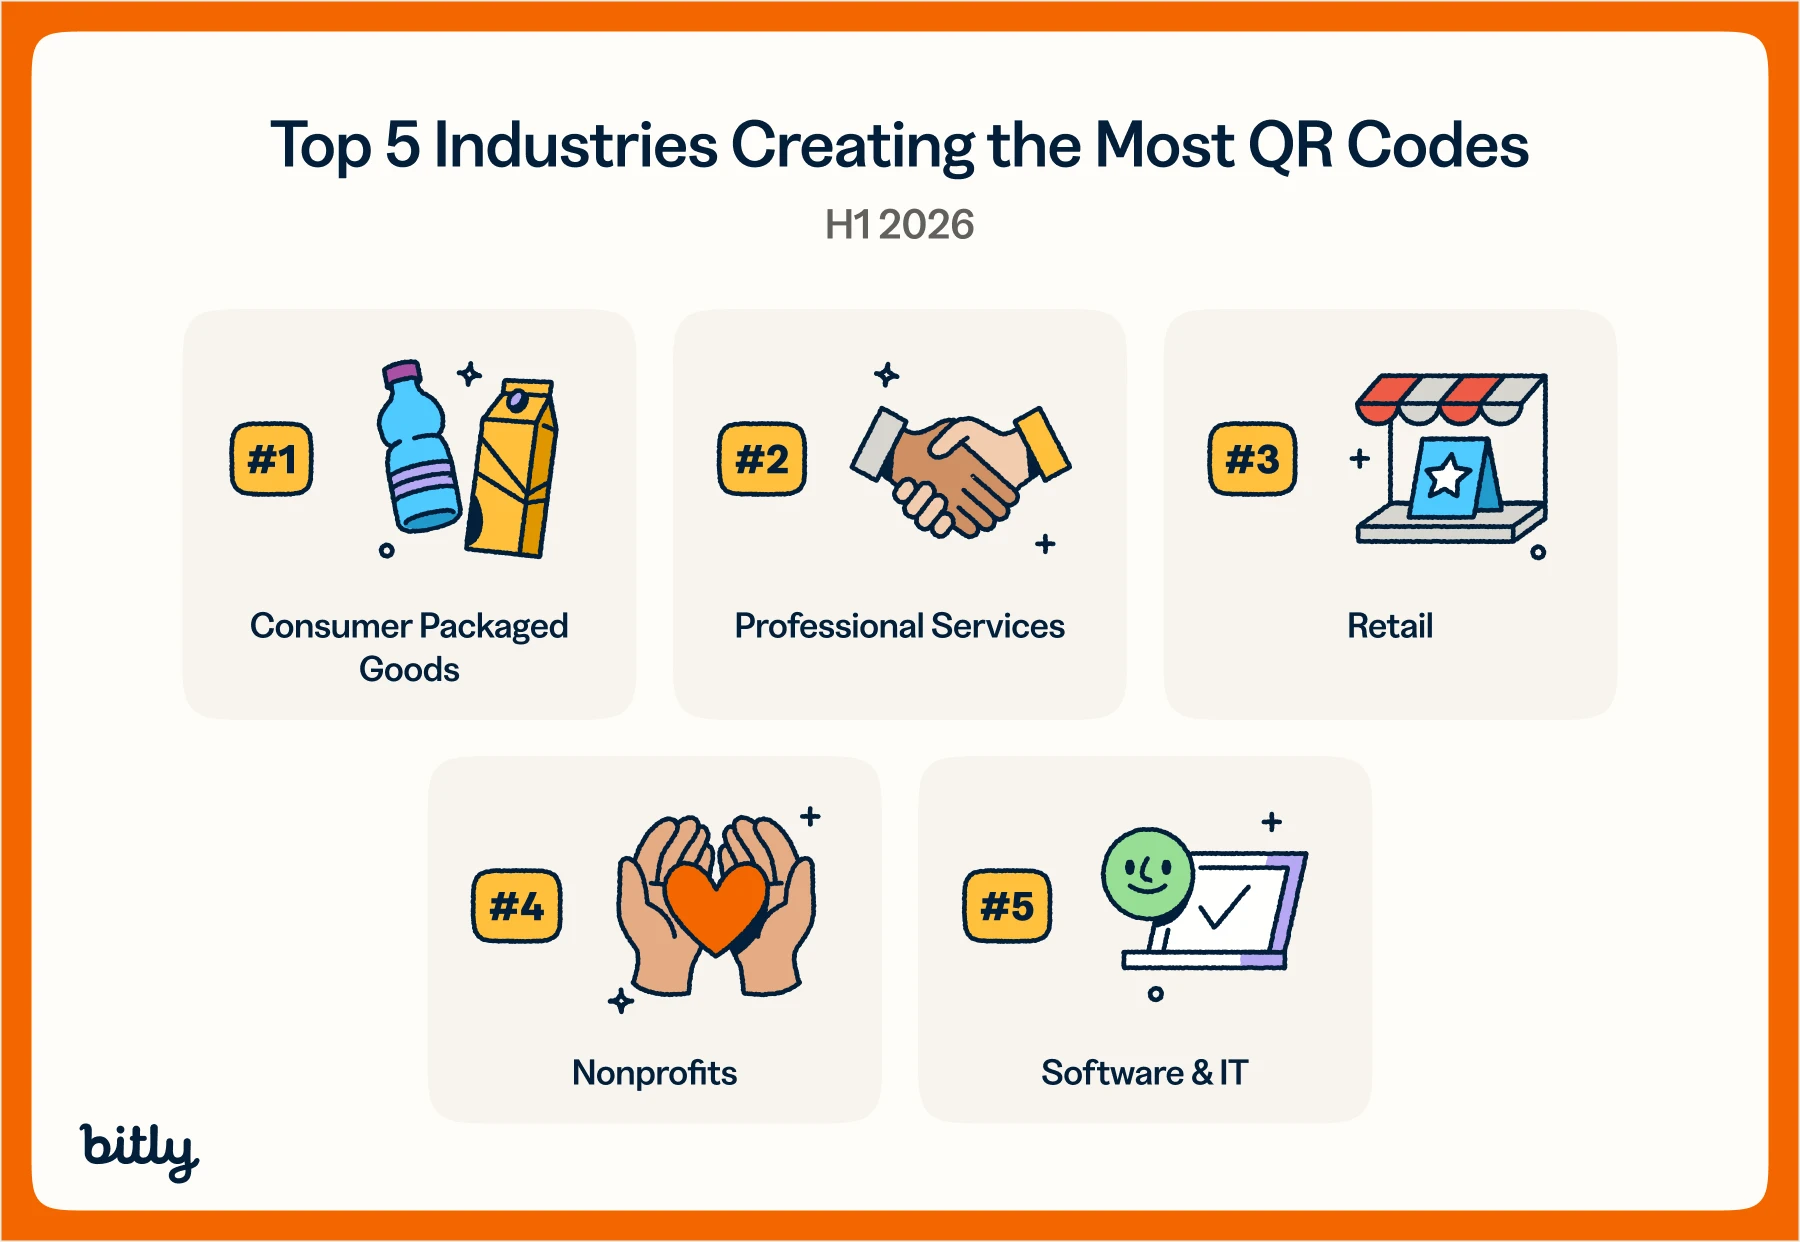
Industry makes a big difference in how QR Codes show up in practice. Some sectors are creating them at higher volumes, others are seeing faster growth in scans, and some are getting far more engagement from each individual code. The top five industries creating the most QR Codes in H1 2026 were:
- Consumer Packaged Goods
- Professional Services
- Retail
- Nonprofits
- Software & IT
When looking year-over-year, the fastest-growing industries for QR Code creation were Restaurants & Leisure (+16.4%) and Professional Services (+2.3%), pointing to continued adoption across hospitality and service-oriented use cases, where QR Codes can connect physical interactions directly to menus, bookings, information, and other digital experiences. (If you’re in retail and want a playbook, see How to Compete with Retail Giants Using QR Codes.)
The industries seeing the fastest growth in QR Code scans tell a slightly different story. The Gym & Wellness (+28%), Professional Services (+23%), and Retail (+21%) industries all saw the strongest year-over-year growth in scans.
What this data tells us is that QR Code creation and QR Code engagement don’t always move in lockstep. The industries creating more QR Codes aren’t necessarily the same ones seeing the fastest growth in scans, which gives us a fuller picture of where adoption is expanding versus where usage is intensifying.
For example, the Government and Real Estate industries generated roughly 83–85% fewer scans per code than the overall average, likely reflecting more targeted use cases than high-frequency ones like restaurant menus. That doesn’t mean those QR Codes are less effective, just that success can look very different depending on the audience and use case.
See it in action: When Legacy Properties Sotheby’s International Realty relaunched their website, more than 120 QR Codes and Bitly Links printed across agent bios, billboards, and yard signs along the Maine coast suddenly all pointed to dead pages. Instead of a five-figure reprint bill, Director of Marketing Dana Whitney updated every code and link from one Bitly dashboard in an afternoon. It’s a good reminder that in an industry like Real Estate, where QR Codes get fewer scans per code than the overall average, the value isn’t always about volume—it’s about flexibility when the destination behind the code has to change.
Trend 3: Small businesses are punching above their weight in QR Code creation
QR Code creation was highest among smaller businesses in H1 2026. Businesses with fewer than 250 employees accounted for roughly 65% of all QR Codes created where company size was known, with companies in the 11–50 employee range representing the single largest segment.
That suggests QR Codes remain especially valuable to smaller organizations looking for a simple way to connect physical touchpoints to digital experiences while also tracking engagement and understanding what’s driving performance.
See how Artie Bars turned festival scans into loyal customers with nothing but a QR Code and a table. Explore more.
Still, QR Code adoption isn’t limited to small businesses—it spans organizations of every size. In the first half of 2026, Entrepreneurs (fewer than 10 employees) accounted for roughly 21% of all QR Codes created—almost identical to the share coming from Enterprise organizations (1,000+ employees), also around 21%. Solo operators and the largest companies are turning to QR Codes in nearly equal measure.
If you’re building a following on your own, see how 3 creators use Bitly QR Codes to grow their business and community.
Trend 4: QR Codes continue to make a global impact
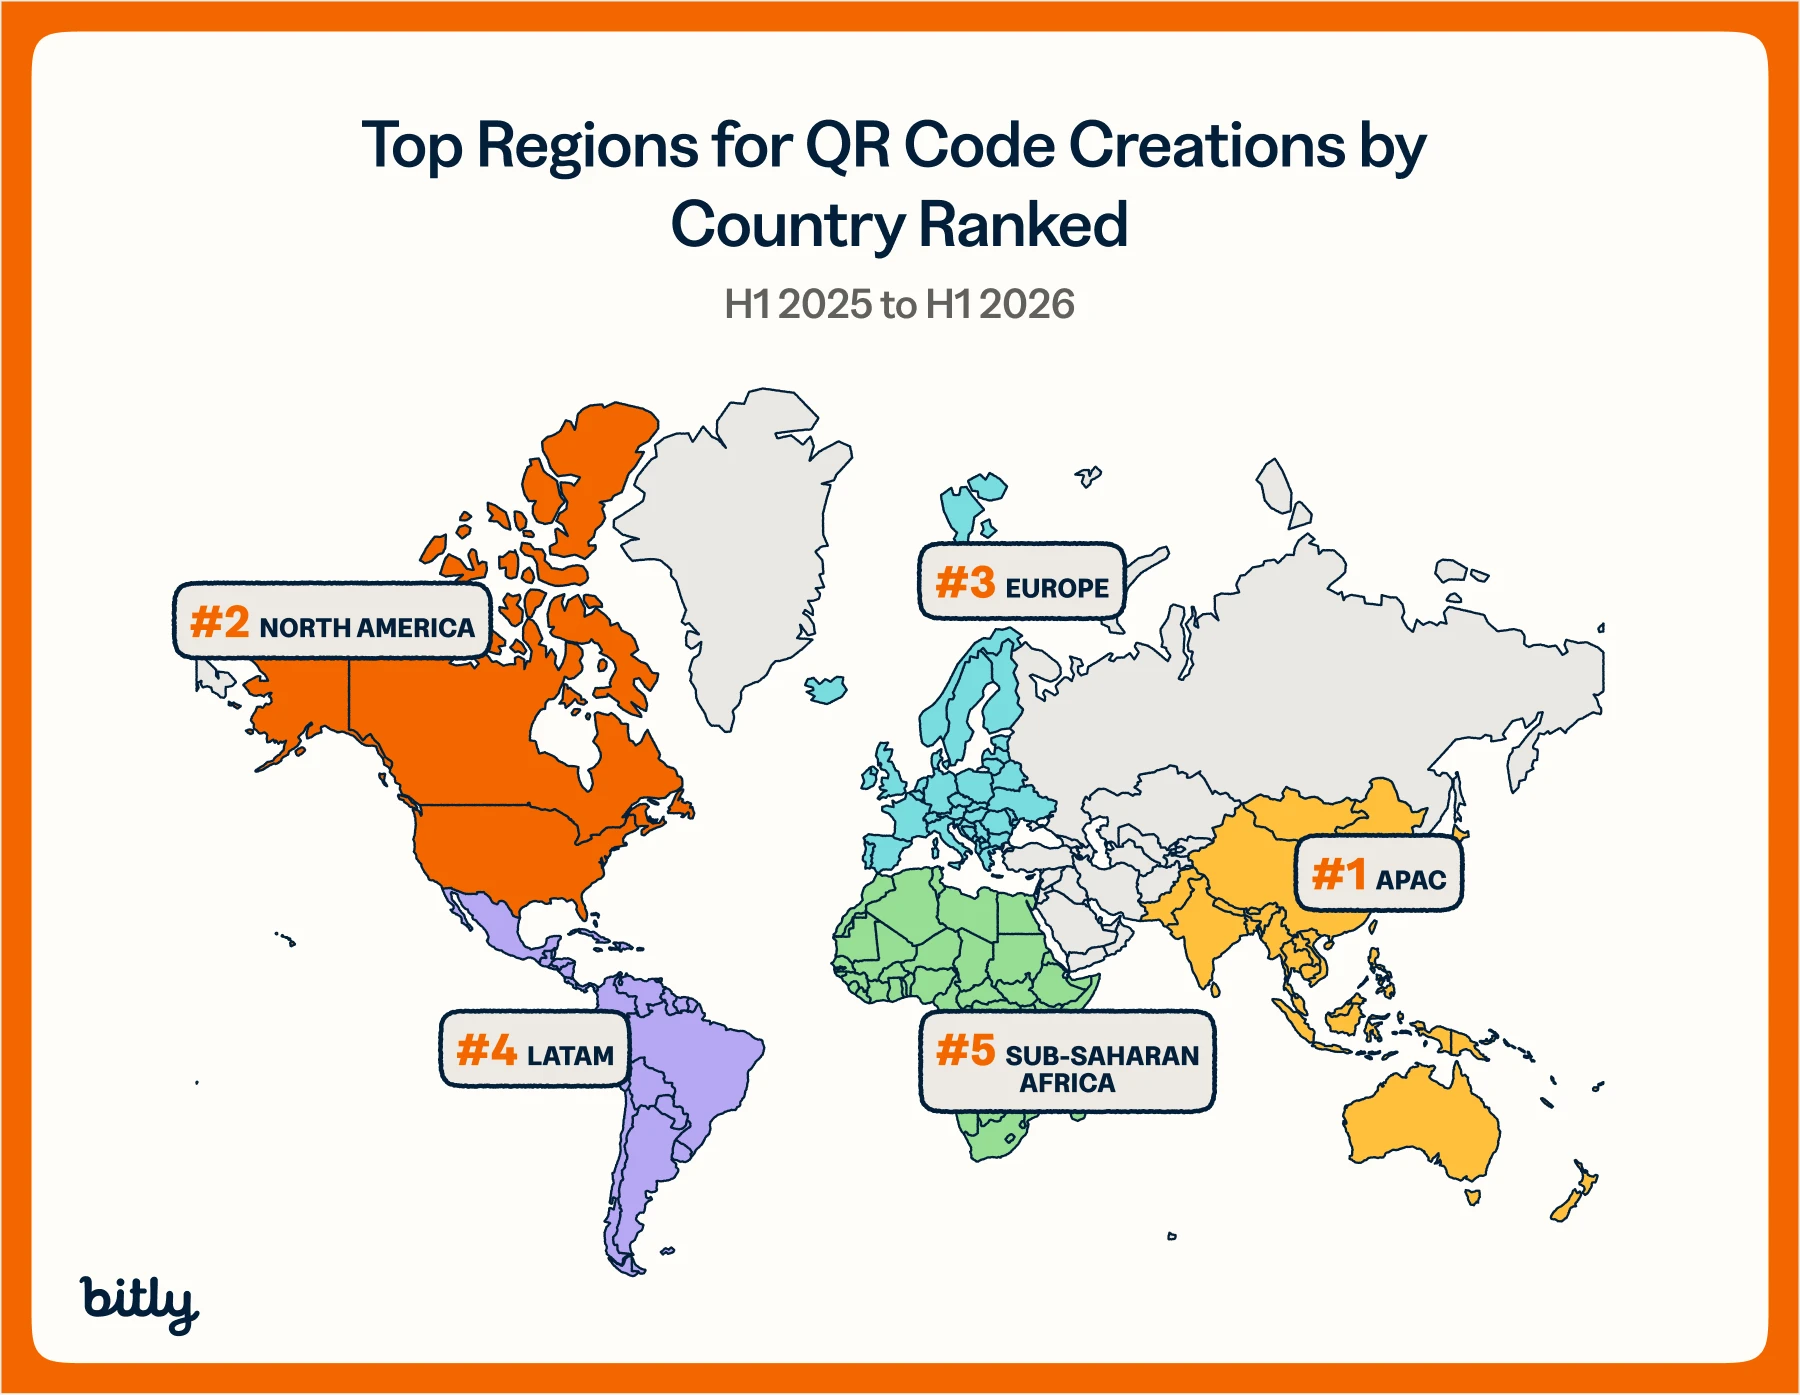
At the regional level, APAC led all regions for QR Code creation in H1 2026, followed by North America, Europe, LATAM, and Sub-Saharan Africa. Indonesia and the Philippines were among the biggest individual drivers of that lead, ranking as two of the largest markets for QR Code creation in H1 2026.
At the country level, the U.S. was the clear leader among the individual countries, generating nearly 8x the QR Code volume of markets like the U.K. Beyond the largest markets, there are a few countries worth watching when it comes to QR Code creation. Mexico (+19%) and Thailand (+8%) both saw QR Code creation grow year-over-year in H1 2026—a sign of expanding adoption in markets that are still relatively early in their QR Code journey. If geography is part of your own strategy, check out this guide on how to adapt a single code’s destination by region.
Trend 5: From boring to main character energy, Businesses are making QR Codes their own
Black remains the most popular QR Code color by a wide margin, followed by white, purple, navy blue, and blue. But among the most common color customizations outside of black and white, blue shades dominate: 61% of the top 10 color customizations were shades of blue.
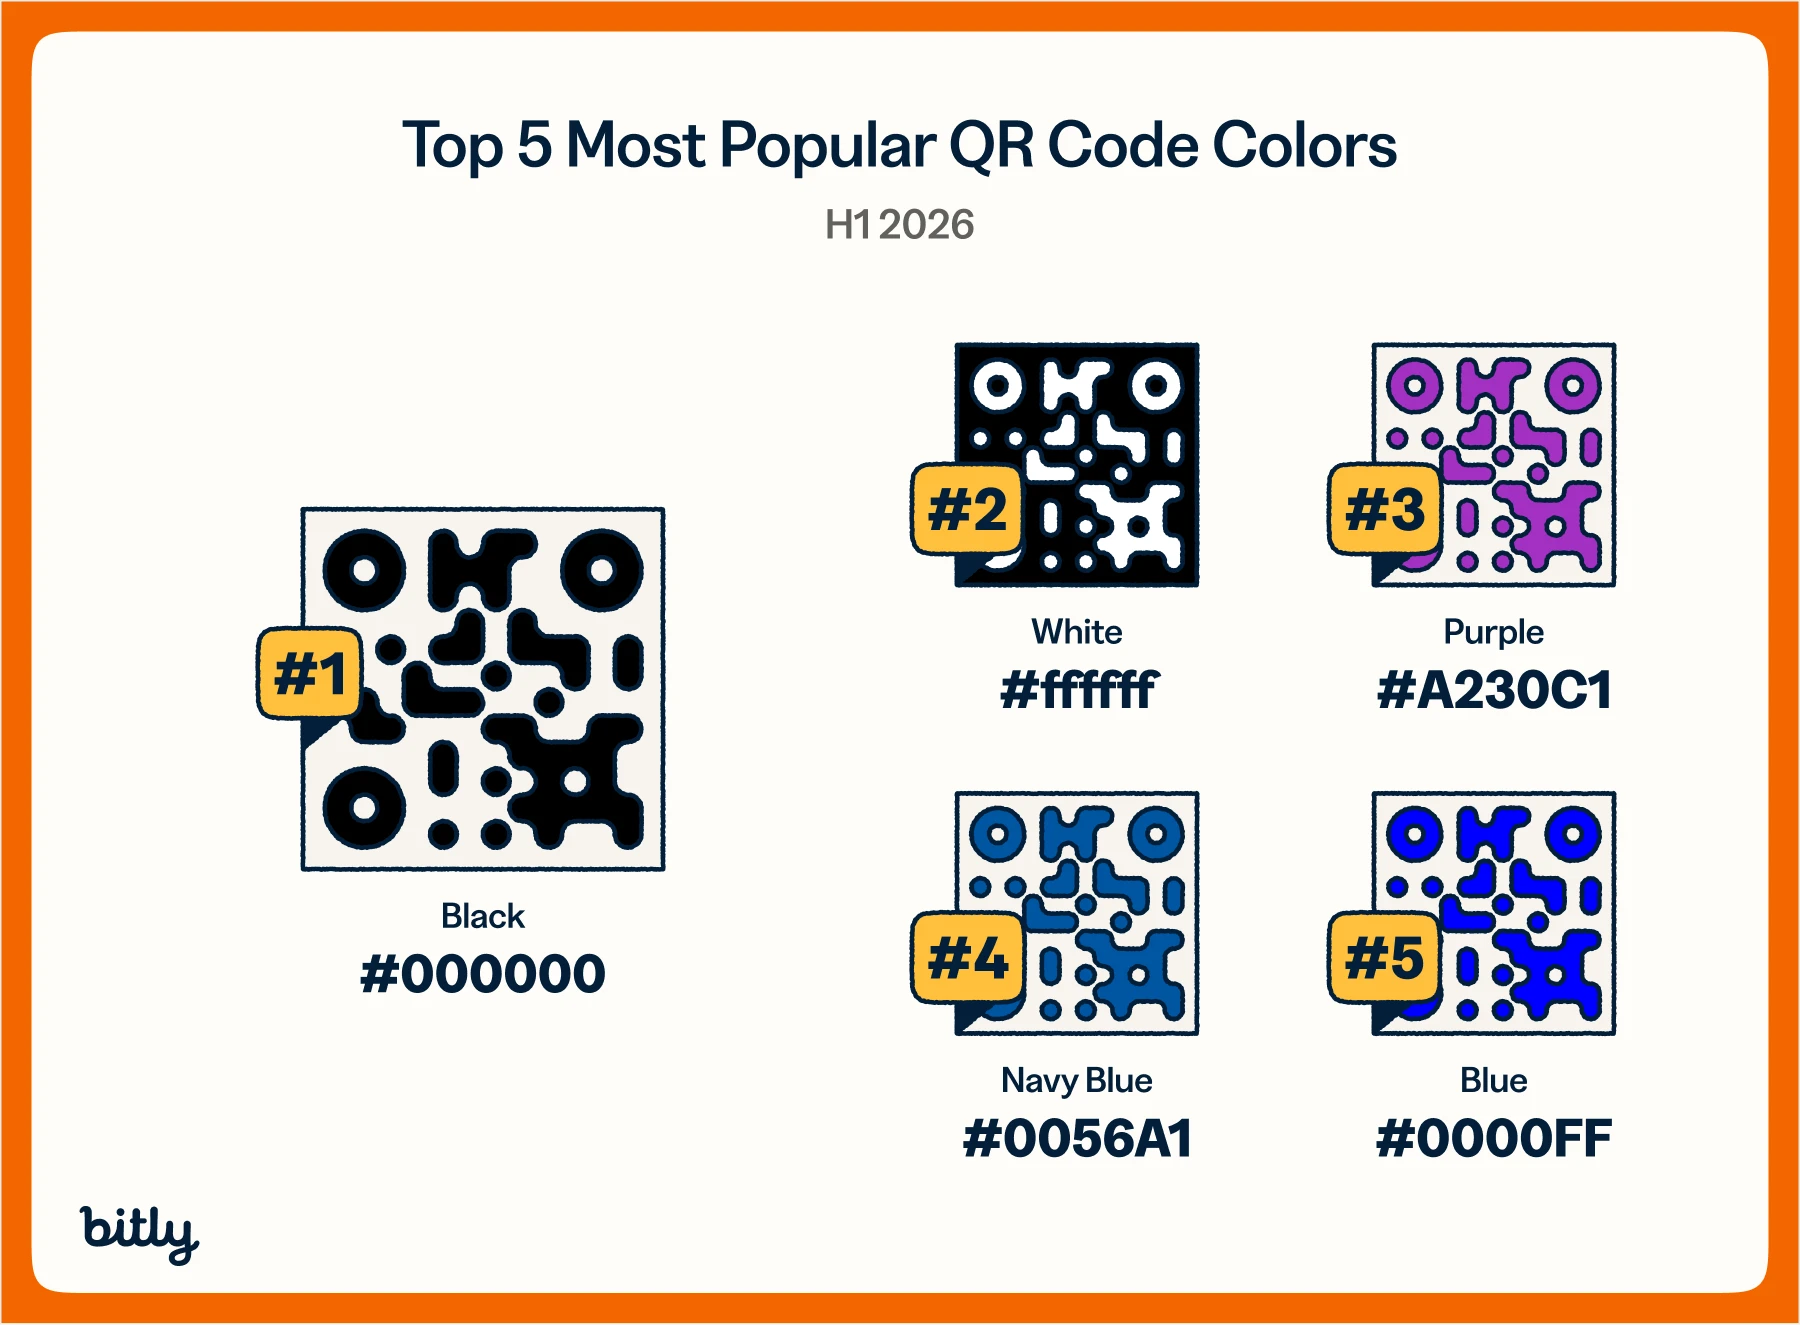
The broader picture is much more varied. In the first half of 2026 alone, users selected more than 17,000 distinct colors, showing the extent to which businesses are moving beyond the standard black-and-white QR Code and adapting codes to their own visual identities.
Logo usage tells a similar story. While “no logo” remains the single most common choice, 2 in 5 QR Codes created in 2026 included a custom uploaded logo.
Want to build one of your own? Check out the QR Code Branding Guide to logos, colors, and frames—or read how to design branded QR Codes that actually get scanned for more on pattern and corner styles.
This data suggests that QR Codes are increasingly being treated as part of the brand experience itself, rather than simply as a functional bridge from one place to another.
Start seeing what’s working with Bitly
QR Codes are no longer just a shortcut to a destination. They’re becoming a measurable part of how businesses connect offline moments to digital experiences.
With Bitly, every scan can become a signal by helping teams understand what’s working, optimize campaigns, and make smarter marketing decisions. Ready to link your marketing? Get started today.