Overview
Most marketers aren’t working without clear visibility by choice. They’re navigating an environment where the volume of data keeps increasing, but clarity doesn’t follow at the same pace.
Over the past few years, the marketing landscape has expanded in every direction. New channels, new formats, new tools, and now AI-driven workflows that make it possible to launch and iterate faster than ever. What once felt manageable now stretches across dozens of touchpoints, each with its own metrics, dashboards, and definitions of success.
Even as marketing has become more complex, the core responsibilities haven’t changed. Marketers are still expected to understand their audience, measure impact, and make informed decisions about where to invest next. But doing that now requires piecing together signals from platforms and systems that were never designed to work together.
That’s where things start to break down.
The visibility gap isn’t just about missing data. It shows up in the day-to-day reality of how marketing teams operate. Insights arrive too late to act on. Signals conflict with one another. And over time, even well-instrumented teams start relying more heavily on instinct to fill in the blanks.
56%
of marketers often or always rely on gut instincts or past experiences to make marketing decisions.
73%
of marketers say they regularly realize a campaign is underperforming only after it’s too late.
26%
of marketers actually base their investments on current performance, leaving budgets misaligned with what works.
These patterns aren’t signs of inexperience or poor strategy. They reflect a system that makes it difficult to see clearly, even when the data is technically there. The gap, however, is not fixed.
When teams are able to connect performance across channels and understand how individual interactions contribute to outcomes, the picture starts to come together. What felt fragmented begins to show patterns. Decisions become more timely and better informed. Marketing shifts from reactive to intentional.
Based on a survey of more than 250 marketing professionals, this report explores where visibility breaks down today, how it shapes performance, and what changes when teams begin to close that gap.
Landscape
Ask any marketer what they do, and you’ll rarely get a simple answer. Most are managing a wide range of responsibilities at the same time. From planning campaigns, creating content, and running paid programs, to analyzing performance and distributing across channels, they’re doing it all, and often all at once.
That breadth adds up quickly. At least seven core marketing responsibilities are owned or executed by a third or more of marketers. Each one comes with its own goals, tools, and definition of success. As more of those responsibilities sit with a single team, maintaining a consistent view of how everything is working together becomes increasingly difficult.
Which of the following marketing responsibilities do you regularly own or execute in your role?
The complexity goes beyond the number of tasks. Each channel, tool, and workflow produces its own set of signals, and those signals don’t always align in a way that makes decision-making straightforward.
When teams are spread across that many moving parts, measurement starts to follow a different logic. Focus tends to shift toward what is easiest to track and quickest to access. Engagement and audience growth rise to the top of the priority list, largely because the data is immediate and visible.
Outcomes like pipeline, revenue, and long-term retention operate on a different timeline. They take longer to surface and require connecting multiple signals across systems. As a result, they are often harder to prioritize in day-to-day decisions, even though they carry more weight for the business.
Which outcomes are most important for your marketing team today?

#1
Engagement and audience growth

#2
Customer retention and loyalty

#3
Revenue impact

#4
Brand awareness

#5
Lead generation

#6
Conversions or sign-ups

#7
Pipeline creation
This distribution of priorities reflects more than preference. It points to how accessible different types of measurement actually are. Engagement and audience growth tend to be easier to observe in real time, while deeper business outcomes require more coordination across systems, teams, and data sources.
That difference shapes how marketers approach measurement. Some metrics feel immediate and dependable, while others require more effort to connect back to specific activities. Over time, that gap influences where attention goes and how success is evaluated.
Here’s how marketers rate the difficulty of connecting their marketing efforts to core outcomes:
*Not sure responses excluded
Engagement, conversions, and lead generation are widely seen as straightforward to track. As measurement moves closer to revenue, that sense of clarity begins to drop. Pipeline stands out as the point where confidence is lowest, even though it represents one of the most important indicators of future growth.
Visibility
Marketers today are expected to know what’s working, but when campaigns span a growing mix of channels, tools, and touchpoints, getting a clear and confident answer is harder than it sounds. And now that AI has made it possible to launch, test, and iterate faster than ever, campaigns that once took weeks can now be created in hours. The volume of activity has increased, but the ability to clearly understand what’s driving results has struggled to keep pace.
With zero-click behavior emerging, private sharing, AI-generated answers, and “dark funnel” interactions, AI is both helping marketers move faster while also making it harder to connect audience engagement back to outcomes. As visibility continues to be a challenge, the interactions marketers can measure become even more valuable for understanding performance and making confident decisions.
Marketers are pulled in every direction
Marketing today spans a wide mix of digital and physical channels. Social media, email, paid search, events, and offline placements all play a role in reaching modern audiences. That mix reflects how people actually move through the world, but it also means performance is spread across more places than ever before.
Which channels are part of your current marketing mix?

72%
Organic social media

54%
Dedicated campaign landing pages

47%
Email or lifecycle campaigns

44%
Paid social

37%
Events or field marketing

33%
Blog posts or guides

31%
Partner or influencer marketing

31%
Search or paid search

28%
SMS or text messaging

25%
Display or programmatic ads
A handful of channels carry most of that weight. Organic social, for example, is used by 72% of marketers, making it one of the most relied-on parts of the mix. Email, landing pages, and paid social also sit at the center of how campaigns are built and scaled.
The challenge is that these channels don’t tell the same story. Social platforms surface engagement almost instantly, but those signals rarely show how attention turns into action. Landing pages capture conversion activity, but offer limited visibility into what brought someone there in the first place. Email connects directly to known audiences, but often operates in isolation from everything happening around it.
The channels doing the most work are not always the ones providing the clearest view of performance. And as more channels are added, that disconnect becomes harder to ignore.
Measurement tools aren’t measuring up
To keep up, marketers have added more tools over time. The result is a growing stack, with the average team now relying on six different platforms to measure performance. Each of these tools focuses on a specific part of the journey. Social platforms track engagement, analytics tools capture on-site behavior, CRM systems follow customer relationships, and automation platforms manage campaign execution. Taken together, they should provide a complete view of performance. In practice, that view is often fragmented.
On average, marketers use six different tools or platforms to analyze performance, with more than a third using seven or more tools.
The most common types of marketing tools and platforms used to measure and analyze performance include:
What stands out is how measurement is distributed. The most widely used tools are focused on individual channels or specific stages of the funnel. Social, web analytics, email, and CRM all sit near the top of the list.
Tools designed to connect performance across those touchpoints are far less common. Attribution and measurement platforms, which are built to link activity to outcomes, are used by a much smaller share of marketers.
The result is a fragmented view of performance. Teams can see what is happening within each channel, but struggle to understand how those channels work together to drive results.
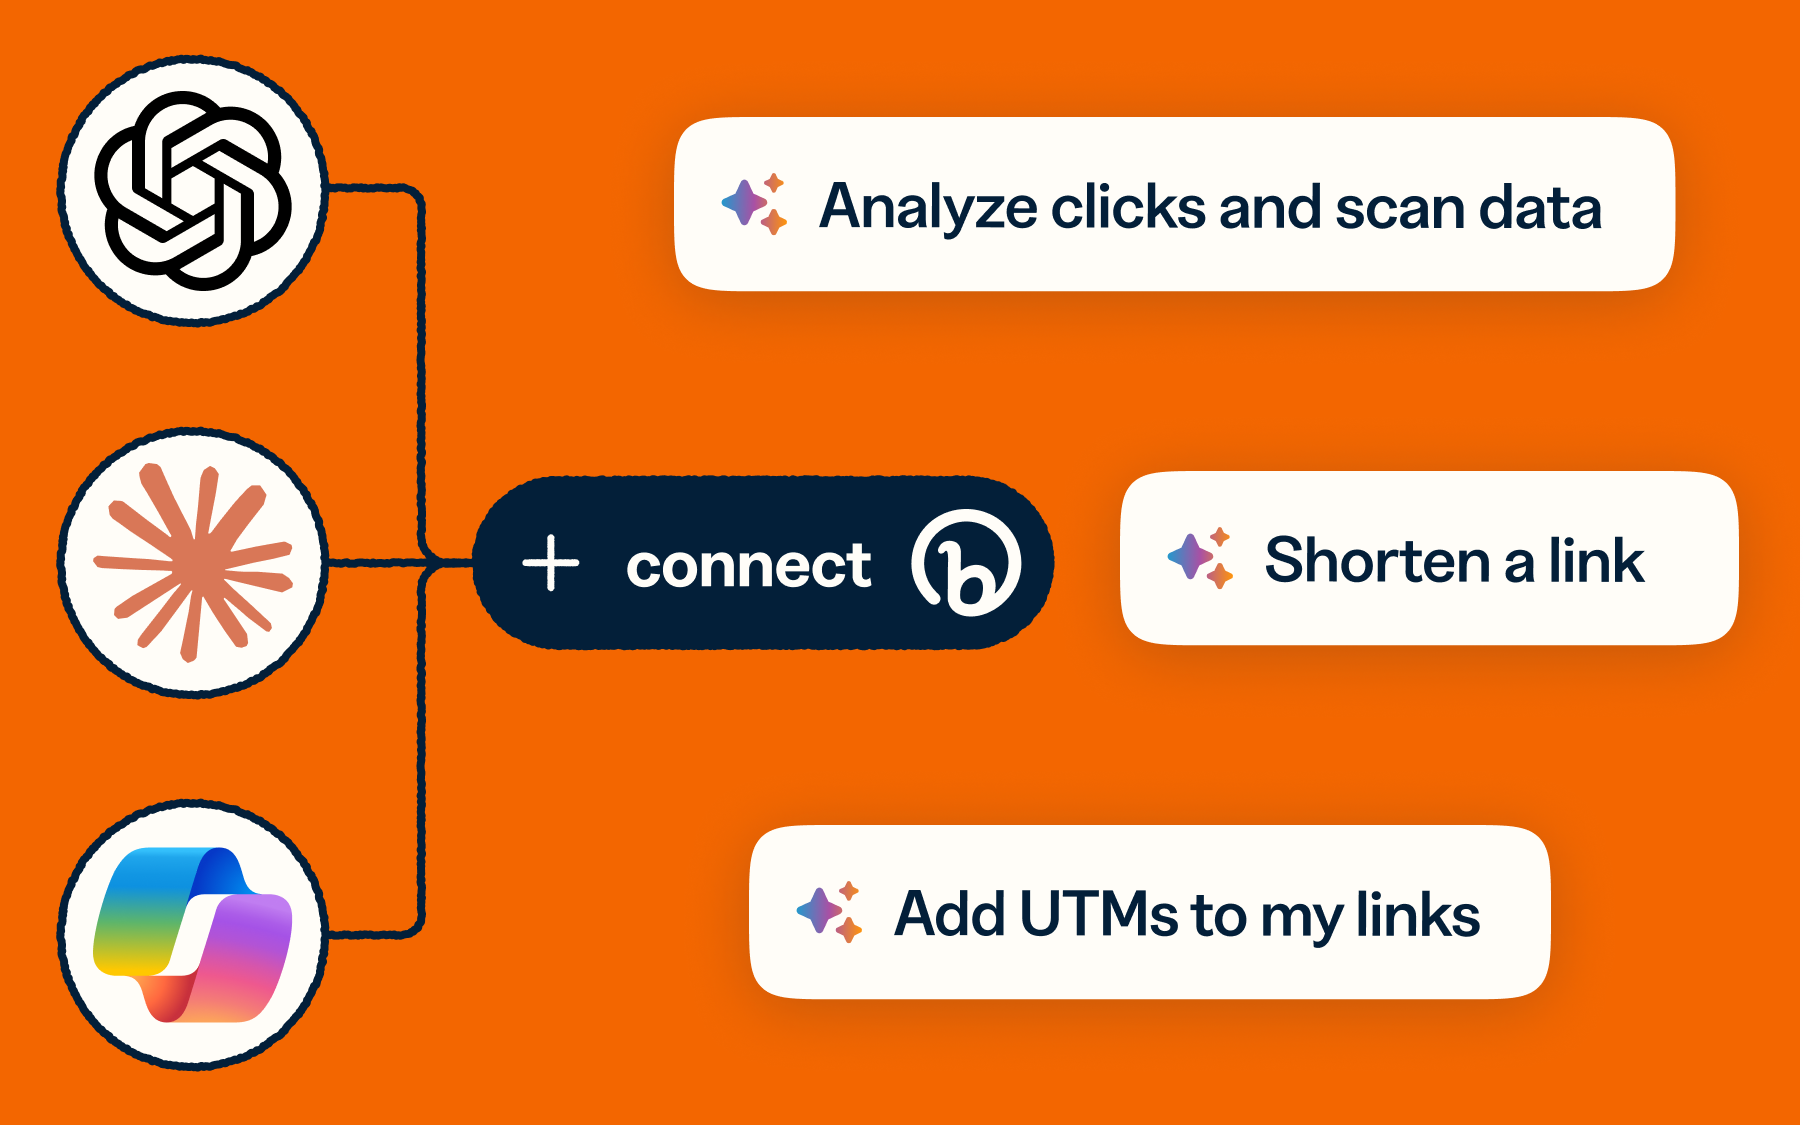
Work across tools without losing visibility
Bitly’s integrations with tools like ChatGPT, Claude, and Copilot bring link creation, tracking, and analytics directly into the workflows marketers already use. Every campaign asset is tracked from the moment it’s created, without the context-switching that fragments your data in the first place.
“These AI tools and integrations are super helpful to smaller organizations like us who have more limited staff or resources. Every 10- to 15-minutes saved on routine tasks is so valuable in our business.” – Justin Richie, Executive Director at XE Media Association.
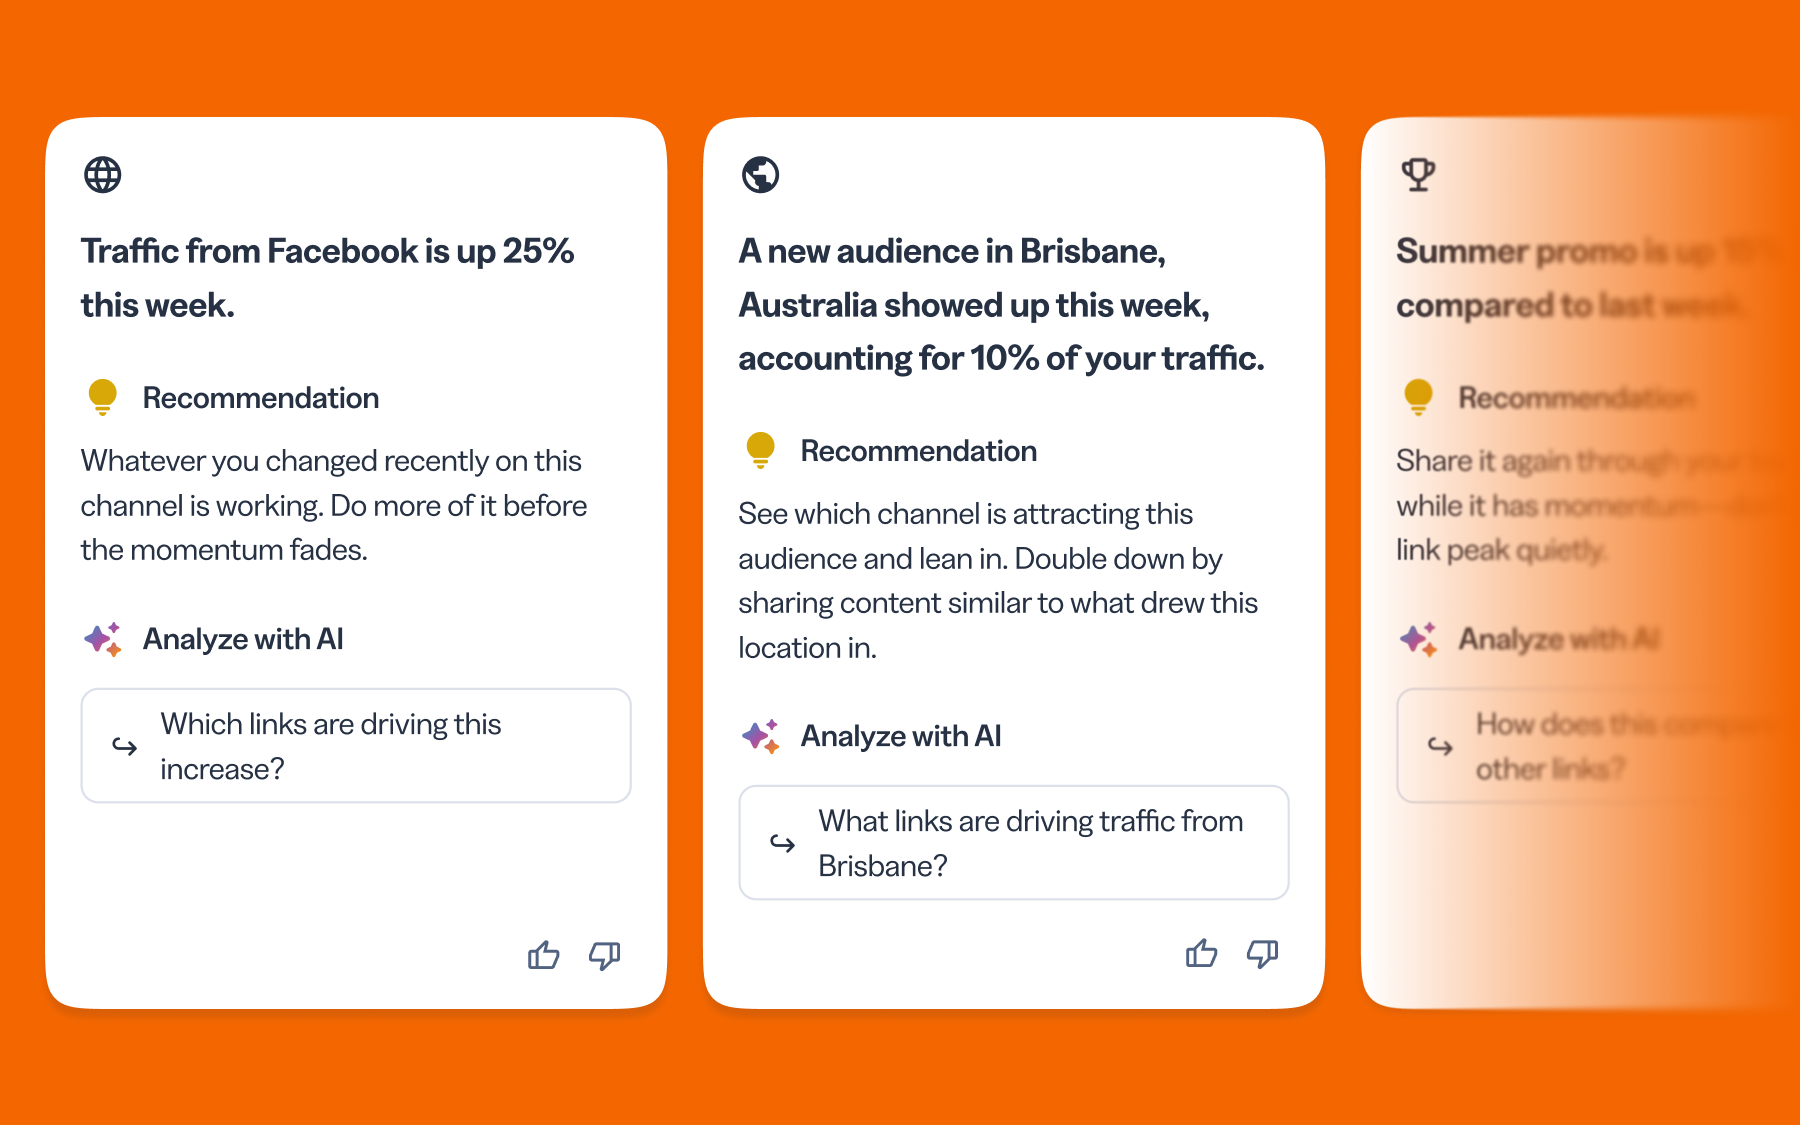
Where the visibility gap shows up most
The visibility gap doesn’t show up evenly across every channel. It tends to surface most clearly in the places marketers rely on the most. As AI tools change how people search, discover, and engage, and as optimizing for generative engines becomes more relevant, the path from attention to outcome isn’t always easy to follow. The signals marketers have relied on for years don’t always tell the full story anymore.
Across which channels do you experience the biggest visibility gaps today?
Organic social media
Dedicated campaign landing pages
Paid social
Search or paid search
Email or lifecycle campaigns
Events or field marketing
SMS or messaging
Display or programmatic ads
Partner or influencer marketing
Offline, print, or physical placements
Organic social sits at the center of that tension. It’s one of the most widely used channels, with 72% of marketers relying on it, and it’s constantly active. Content goes out, engagement comes in, and there’s always something to point to. But that activity doesn’t always translate into something meaningful for the business.
Landing pages create a similar kind of disconnect. They sit close to conversion and are often treated as a source of truth for performance. But without a clear view into how visitors arrive or what influenced them along the way, it becomes difficult to understand why certain campaigns work or how to repeat that success.
What makes this harder is the pace at which these channels operate today. Teams are publishing more content, launching more campaigns, and iterating more quickly, often with the help of AI. Without a clear view at the channel level, teams are left working with partial signals.
Performance Signals
Behind every fragmented dashboard and disconnected tool is a marketer trying to make a call with incomplete information. That reality shows up in small ways at first. A campaign looks strong in one platform and underwhelming in another. A spike in engagement doesn’t line up with conversions. A report answers one question but raises three more.
Over time, that uncertainty starts to add up. It affects how quickly teams can move, how much they trust what they’re seeing, and how confident they feel making decisions.
Marketers are expected to test, learn, and improve performance continuously. That only works when there’s a clear signal to respond to. Right now, for many teams, that signal is harder to find than it should be.
What’s the hardest part about understanding what’s working in marketing?
#1
Data is spread across too many tools
#2
There are too many customer touchpoints to track
#3
It’s difficult to connect performance to outcomes
When asked what makes performance hardest to understand, marketers point to the same set of challenges. Data is spread across too many tools. Customer journeys stretch across too many touchpoints. And connecting activity to outcomes remains difficult.
These aren’t isolated issues—they actually reinforce each other. More tools create more fragmentation, more touchpoints create more complexity, and the connection between the two becomes harder to trace.
Limited visibility buries insights
Most teams have access to performance data. Far fewer have a clear, detailed view of how customers actually move across channels or which interactions are driving decisions. Only a small share of marketers say they have a clear view of what’s working, and many describe their visibility as partial or inconsistent.
Only 18% of marketers say they have a clear view of what’s working, while nearly half report limited or inconsistent visibility.
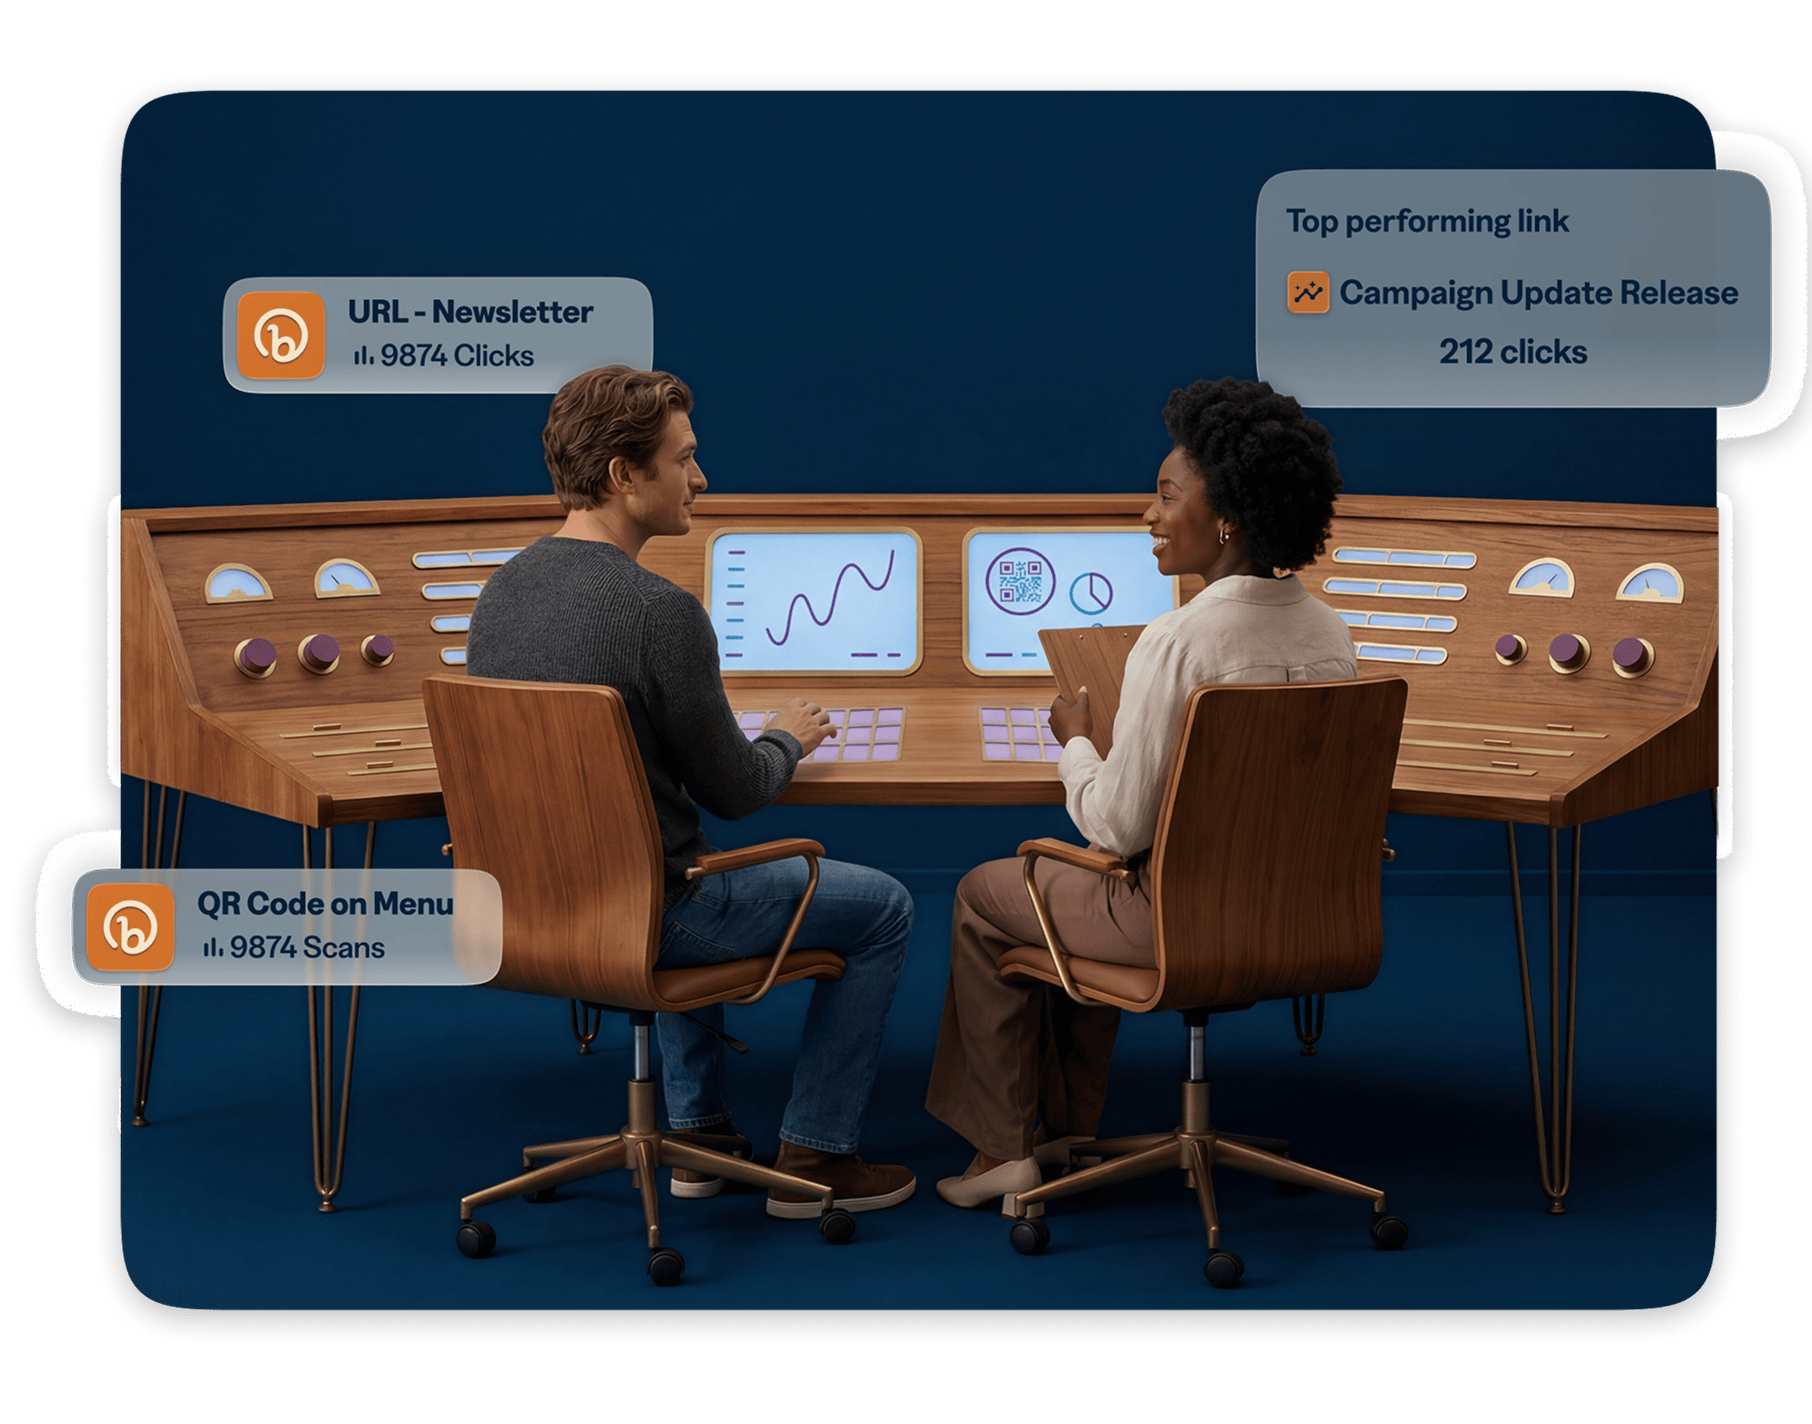
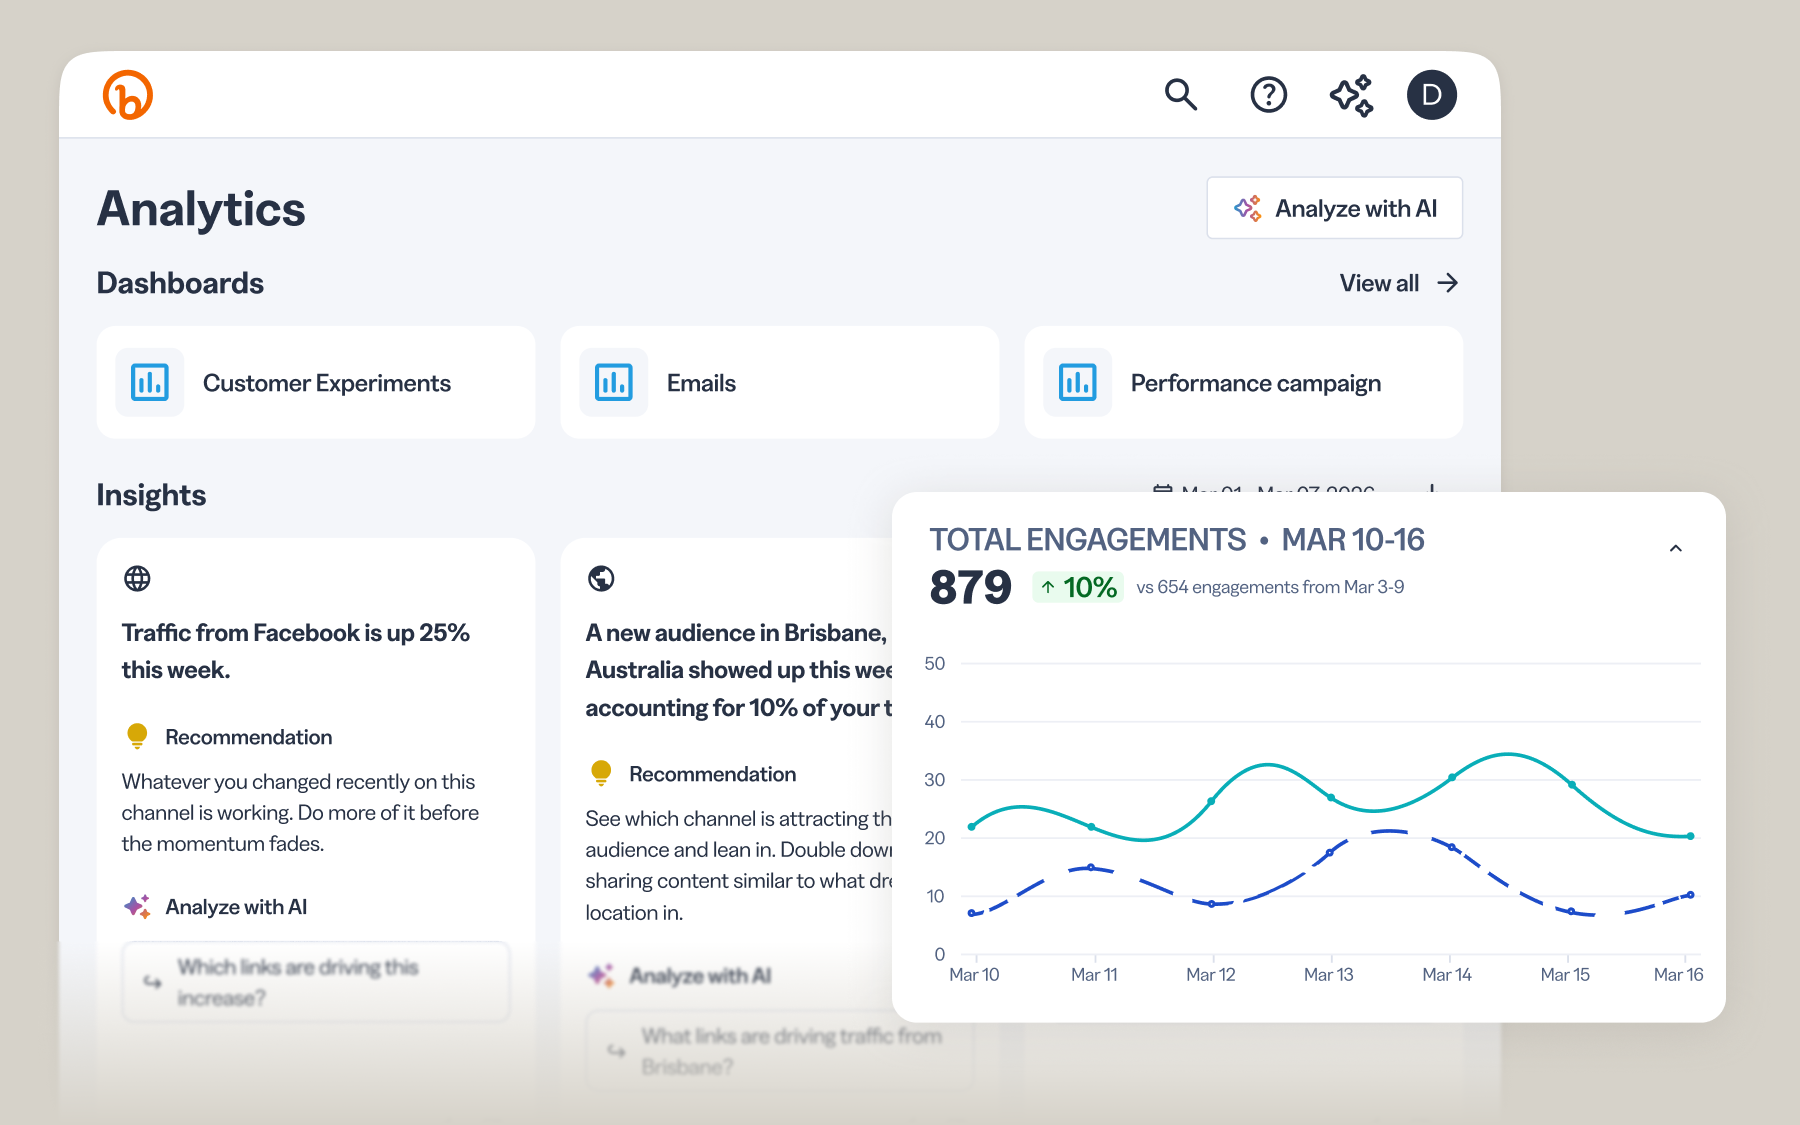
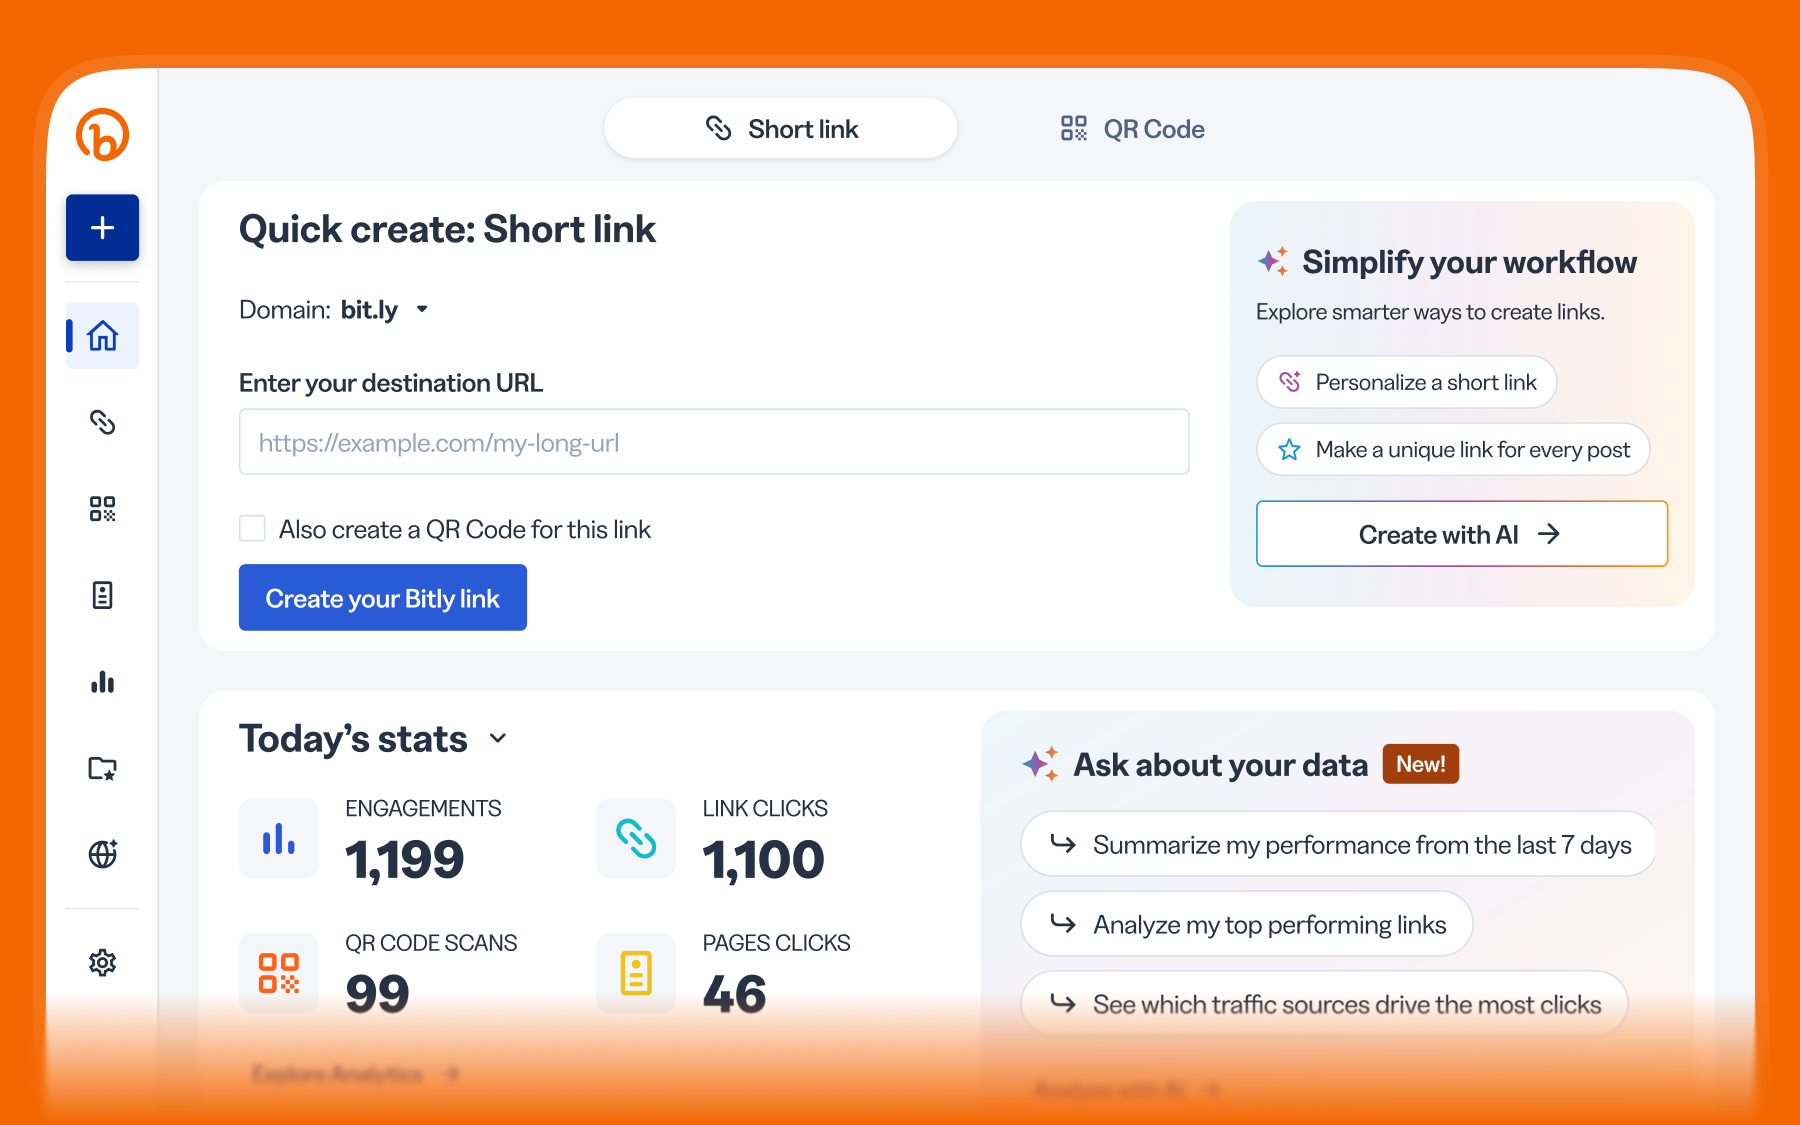
See the full picture sooner
Bitly Analytics brings clicks and scans across links, QR Codes, and landing pages into one place, giving you a clearer view of how people engage across channels. By surfacing early signals in real time, teams can understand what’s working while campaigns are still live—not after the fact.
“People always ask me, ‘How do you know where your audience is actually coming from?’ I track clicks by platform, campaign, or location, all in one beautiful dashboard.” – Tess Barclay, a digital marketer & YouTube creator on Bitly Analytics.
This challenge becomes more noticeable as customer journeys continue to expand. AI-driven discovery, new content formats, and always-on campaigns have increased the number of interactions that happen before a decision is made. More signals are available, but they don’t always connect in a way that reflects how people actually move from interest to action.
To what extent does your current marketing reporting reflect how customers actually move across channels and touchpoints?
Reporting provides a comprehensive view, or closely mirrors how customers actually move
Reporting reflects major stages but lacks detail
Reporting captures some touchpoints but misses others, or largely fails to reflect real customer movement
The split here is telling. Some teams are getting closer to a view that reflects real customer behavior. Many others are still working with reporting that captures only part of the journey or misses key touchpoints entirely. Progress is happening, but it’s uneven. And for a large portion of teams, understanding what’s working still requires filling in gaps.
Interactions remain a blind spot
Even when teams can see performance data, they’re often looking at it at a level that’s too broad to explain what actually happened. Campaign-level and program-level reporting can show trends over time, but they don’t always reveal what caused those outcomes.
Where marketers evaluate and make decisions about marketing performance:
- At the overall marketing or program level
- At the campaign level across multiple channels
- At the individual channel level
- At the interaction or touchpoint level
- We use multiple levels without a clear primary
- We do not have a consistent approach
Just over half (56%) of marketers make performance decisions at the overall program or campaign level. Only 14% evaluate performance at the individual interaction or touchpoint level, where a link click, a QR Code scan, or a page visit can reveal exactly what moved someone from interest to action.
As marketing continues to accelerate, that distinction becomes more important. AI is changing how quickly campaigns are created, tested, and scaled. Timelines are shorter, and expectations for real-time optimization are higher.
In that environment, waiting for insights to surface after a campaign ends slows everything down. The teams that move faster are not necessarily running more campaigns or using more tools. They are the ones that can see what is happening at the interaction level and respond while it’s still unfolding.
Marketing Decisions
Having data and being able to act on it are two very different things. Most teams aren’t operating without data. They’re operating with data that takes time to interpret, validate, and align around. By the time a signal feels clear enough to act on, the moment to respond has often already passed.
Only about half of marketers say they have enough visibility into interactions and touchpoints to make decisions without hesitation. The rest are left double-checking sources, reconciling conflicting signals, or waiting for enough confidence to move forward. In fast-moving campaigns, that pause adds up quickly.
On average, it takes marketers about five days to act on new performance insights. That may not sound significant on its own, but in a campaign that runs for a couple of weeks, five days can represent a large portion of the window to make meaningful adjustments.
5 days
is the average time it takes for marketers to take action after new marketing insights emerge
In practice, acting on insights is rarely immediate. It often involves checking multiple systems, aligning with stakeholders, and building a case strong enough to support a decision. The data may exist, but turning it into action takes time.
How often do you realize that a campaign is underperforming only after it’s too late to meaningfully adjust it?
That delay shows up clearly in performance. A meaningful share of marketers report realizing a campaign is underperforming only after the opportunity to adjust has passed. By the time the signal is clear, the outcome is already set.
One-third of marketers say they regularly realize a campaign is underperforming only after it’s too late to make meaningful changes.
When data fails, gut instinct takes over
Most marketers don’t intend to rely on instinct alone. But when data is delayed, incomplete, or difficult to interpret, decisions still need to be made.
In those moments, experience becomes the fallback. Teams lean on what has worked before, what feels familiar, or what seems most likely to perform. It’s a practical response to uncertainty, especially when timelines are tight and expectations are high.
How often do you rely on gut instinct or past experience when making marketing decisions?
Marketers are more than twice as likely to trust their instinct or past experience over quantitative data when they need to move quickly.
Over time, this creates a compounding problem. Campaigns take longer to optimize. Learnings are harder to transfer. Performance improvements are harder to sustain. And the feedback loop that should be getting tighter with every campaign instead stays frustratingly slow.
Operational friction slows everything down
Visibility gaps and delayed insights are at the core of the problem, but they’re not the only factor. Even when teams have access to useful data, internal processes can slow down their ability to act on it.
When asked what limits their ability to act on performance insights, marketers point to a familiar set of constraints. Budgets are often set before insights fully emerge. Approval processes introduce delays. And in some cases, uncertainty around the data itself creates hesitation at the exact moment when speed matters most.
What most limits your ability to act on performance insights?

#1
Budget or plans already being locked in

#2
Insights arriving too late to act on

#3
Decision approvals taking too long

#4
Not trusting the data enough to act
These challenges extend beyond individual decisions and shape overall performance. Limited time, constrained budgets, and the complexity of managing many channels all contribute to slower execution. Misalignment across teams and stakeholders can add further friction, even when the path forward is clear.
What most limits your ability to improve marketing performance today?

#1
Limited time or team capacity

#2
Limited budgets

#3
Too many channels or touchpoints to manage

#4
Slow approvals or stakeholder alignment

#5
A lack of clear visibility into what’s working
What shows up here is familiar to marketers in a different way. The biggest constraints aren’t just about data. They’re about the time it takes to access and analyze it, the capacity to act on it, and the reality of managing too many things at once.
Visibility is a top five challenge overall, but it’s one piece of a much larger set of pressures. Even when teams know what’s working, acting on it isn’t always straightforward. What starts to change is not just what teams can see, but how quickly they can respond. Getting to insights faster, and at a more granular level, is helping teams move from disconnected data to clearer signals they can actually act on.
Opportunities
Despite everything covered in this report, marketers aren’t resigned to the status quo. When asked what would make the biggest difference to their performance over the next year, the answers are clear, consistent, and luckily, not that far out of reach.
Which change would have the biggest impact on improving your marketing performance over the next year?
*Percentages may not total 100% due to rounding.
Faster execution ranks first, better visibility ranks third, and while increased budget sits at second, budget alone doesn’t solve a visibility problem. It just means making the same uncertain decisions with more money on the line.
What marketers are really asking for, across all of these priorities, is the ability to move quickly and confidently. Those two things are more connected than they might seem—and right now, the conditions to achieve both of them are better than they’ve ever been.
Accelerate analysis with AI
One of the most significant opportunities available to marketing teams right now is one that most haven’t fully reached for yet.
Only 16% of respondents said that they regularly use AI as part of their standard workflow to measure or analyze marketing performance.
In an era where AI is reshaping how campaigns are built, launched, and scaled, marketing analysis has been slower to follow, and that gap represents both a problem and an opening.
The problem is that manual reporting is still the norm for most teams. It slows down the path from insight to action, introduces inconsistencies, and makes results harder to trust. In fast-moving campaigns, that lag is expensive.
The opening is that AI is already proving it can close that gap for the teams using it. Among marketers who have brought AI into their performance analysis workflow, more than half report faster access to insights. Others cite:
- Clearer interpretation of data
- Faster ability to act
- Greater confidence in decisions
- More actionable performance insights
This is the difference between catching a problem while a campaign is still live and finding out about it after the budget is spent. This is also where the “why now” becomes impossible to ignore. AI is compressing the timelines of everything in marketing, from how quickly campaigns can be built to how fast audiences can be reached to how rapidly strategies need to evolve. Teams that are still relying on manual analysis to keep pace with AI-accelerated execution are going to find that gap widening.
Invest in what works
Faster insights only matter if they lead to smarter investment decisions. And right now, for most teams, budget allocation is still more art than science.
Which statement best reflects how your team allocates marketing budget today?
- We shift more budget toward top-performing channels
- We distribute budget across channels to maintain presence
- We base budget decisions primarily on historical patterns
- Budget allocations are largely fixed
- Not sure
Over a third of marketers spread resources across channels just to maintain presence, and another quarter base decisions primarily on historical patterns. Both approaches have the same underlying problem: they rely on assumptions about what’s working rather than a clear view of what actually is.
How often do budget decisions feel constrained by uncertainty about performance?
The consequence is significant. 80% of marketers say uncertainty about performance at least occasionally constrains how they allocate budget. That means the majority of marketing investment is being made under conditions of incomplete information—which is exactly the kind of problem that better visibility is designed to solve.
When performance is easier to measure and compare across channels, budget decisions stop feeling like educated guesses. Teams can see which efforts are gaining traction, which channels are delivering real value, and where the next dollar is most likely to have an impact. Investment starts following performance rather than the other way around.
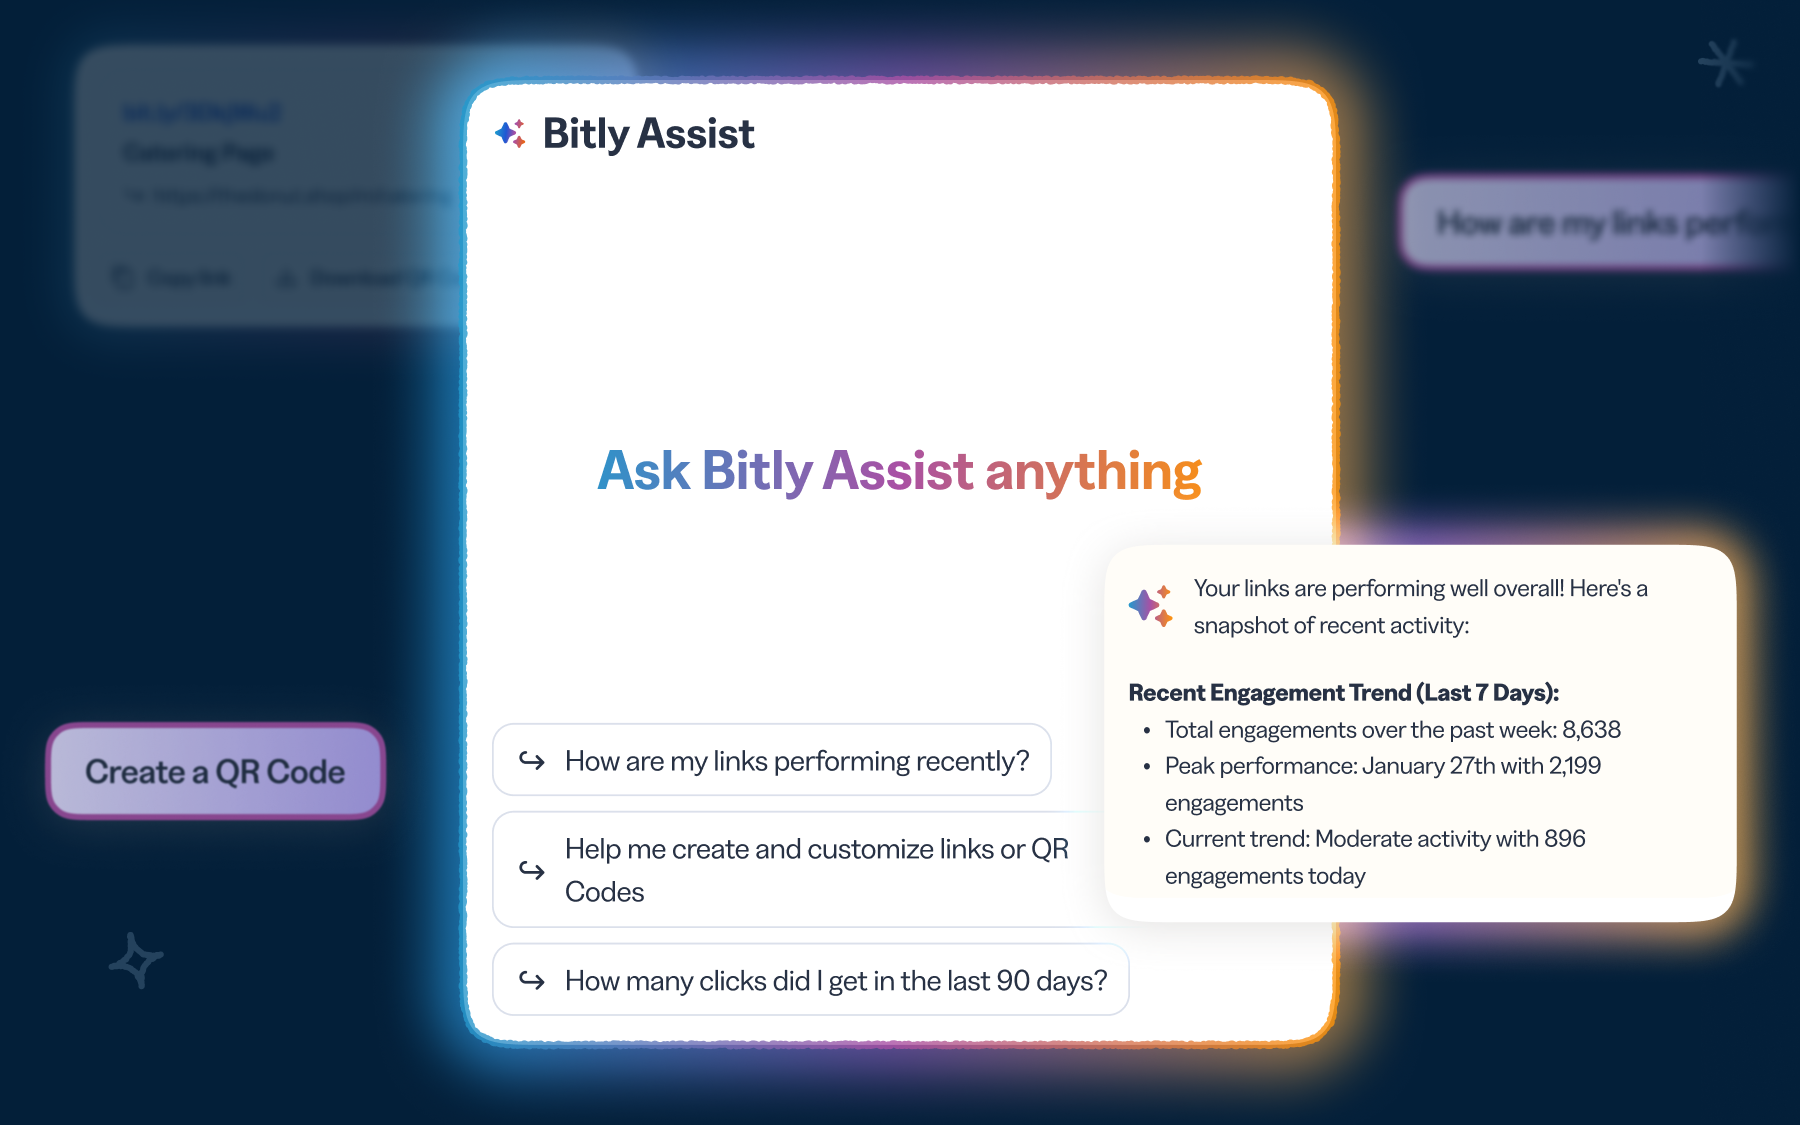
Make smarter investment decisions
Weekly Insights in Bitly Analytics automatically surfaces meaningful changes in performance, helping teams quickly see what’s gaining traction and where to adjust. With clearer signals delivered regularly, it becomes easier to put budget behind what’s working with confidence.
“We’ve seen our click-throughs on advocacy content increase over time because we can see where engagement is coming from across platforms.” – Ezra Varley, Communications Specialist at Pasado’s Safe Haven
Turning visibility into action
Across these priorities—faster execution, better insights, and more effective investment—the same underlying need keeps showing up. Visibility is what allows everything else to work the way it’s supposed to.
When marketers can see how interactions connect to outcomes, the way they work starts to shift. Decisions happen faster because the signal is clearer. Underperforming campaigns are easier to catch and adjust while they’re still live. Budget becomes easier to direct because there’s a stronger understanding of what is actually driving results, not just what looks like it might be.
For most teams, getting there doesn’t mean starting over. It usually begins with a clearer view of what’s already happening, connecting signals that already exist but haven’t been easy to see together. Instead of looking at isolated metrics, teams can start to understand how actions across channels add up over time, and what actually moved someone from interest to action.
That kind of clarity changes how decisions feel. There’s less second-guessing, less back-and-forth to validate what the data is saying, and more confidence in moving forward. The gap between insight and action starts to shrink in a way that’s noticeable day to day.
The data is already there, and more teams are starting to find ways to bring it together in a way that reflects how marketing actually works. For those teams, the impact shows up across everything they do, from how quickly they respond, to how they invest, to how consistently they improve over time.
Takeaways
Marketers today have more data than ever, but turning that data into clear, actionable insight remains a challenge. Across channels, tools, and touchpoints, visibility gaps make it harder to understand what’s working and act with confidence.
A few patterns stand out:
- Visibility breaks down across systems, leaving teams with fragmented signals instead of a complete view of performance
- Insights arrive too late to act on, slowing decisions in environments that demand speed
- In the absence of clear signals, instinct fills the gap, making performance harder to repeat and scale
- Budget and effort follow assumptions, not outcomes, limiting overall impact
As campaigns expand across more channels and move faster than ever, what teams need isn’t more data. They need a clearer way to connect interactions, understand what’s working, and act while it still matters. That shift starts by making the signals that already exist easier to see and easier to use.
When interactions are visible at the link or touchpoint level, teams can understand what actually drives action. Performance becomes easier to compare across channels, making investment more confident and more precise. And as insights surface in real time, teams can adjust while campaigns are still live.
That’s what true marketing visibility looks like in practice. And it’s exactly what Bitly is built to deliver. Bitly brings links, QR Codes, and cross-channel analytics together in one place so marketers can see what’s working and act on it with confidence.
Stop the guesswork with Bitly
Get the clarity you need to move with confidence and make every effort count. Track every link and QR Code, connect your channels, and see what’s working.
Methodology
About Bitly
Bitly is a leading global platform for link and QR Code management, enabling brands and businesses to create, manage, and measure digital interactions across online and offline channels. Used by millions of monthly active users and hundreds of thousands of customers across 190 countries, Bitly helps teams deliver reliable experiences and gain clear insights into what’s working across their connections.
About UserEvidence
UserEvidence is a software company and independent research partner that helps B2B technology companies produce original research content from practitioners in their industry. All research completed by UserEvidence is verified and authentic according to their research principles: Identity verification, significance and representation, quality and independence, and transparency. All UserEvidence research is based on real user feedback without interference, bias, or spin from our clients.
UserEvidence Research Principles
These principles guide all research efforts at UserEvidence—whether working with a vendor’s users for our Customer Evidence offering, or industry practitioners in a specific field for our Research Content offering. The goal of these principles is to give buyers trust and confidence that you are viewing authentic and verified research based on real user feedback, without interference, bias, and spin from the vendor.
Principle 1: Identity verification.
In every study we conduct, UserEvidence independently verifies that a participant in our research study is a real user of a vendor (in the case of Customer Evidence) or an industry practitioner (in the case of Research Content). We use a variety of human and algorithmic verification mechanisms, including corporate email domain verification (i.e., so a vendor can’t just create 17 gmail addresses that all give positive reviews).
Principle 2: Significance and Representation
UserEvidence believes trust is built by showing an honest and complete representation of the success (or lack thereof) of users. We pursue statistical significance in our research, and substantiate our findings with a large and representative set of user responses to create more confidence in our analysis. We aim to canvas a diverse swatch of users across industries, seniorities, personas – to provide the whole picture of usage, and allow buyers to find relevant data from other users in their segment, not just a handful of vendor-curated happy customers.
Principle 3: Quality and Independence
UserEvidence is committed to producing quality and independent research at all times. This starts at the beginning of the research process with survey and questionnaire design to drive accurate and substantive responses. We aim to reduce bias in our study design, and use large sample sizes of respondents where possible. While UserEvidence is compensated by the vendor for conducting the research, trust is our business and our priority, and we do not allow vendors to change, influence, or misrepresent the results (even if they are unfavorable) at any time.
Principle 4: Transparency
We believe research should not be done in a black box. For transparency, all UserEvidence research includes the statistical N (number of respondents), and buyers can explore the underlying blinded (de-identified) raw data and responses associated with any statistic, chart, or study. UserEvidence provides clear citation guidelines for clients when leveraging research that includes guidelines on sharing research methodology and sample size.
Methodology
Bitly commissioned third-party research firm UserEvidence to run an online, independent market survey of 264 marketers. Respondents came from a range of industries, with the most common being retail and eCommerce (27%) and media and entertainment (22%).
We saw healthy representation from small organizations with fewer than 50 employees up to large enterprises.
Employee count
On average, the organizations respondents worked for had 351 employees.
Organizational go-to-market (GTM) models included business-to-consumer (B2C), business-to-business (B2B), and hybrid, with a handful from the public or nonprofit sectors.
Survey respondents came from all levels of their organizations, providing comprehensive insight into the highest levels of leadership as well as the individual contributors who execute campaigns.
Half of the respondents we surveyed (50%) said marketing was their primary job focus, while 36% said it was a regular part of their role, and 14% said they occasionally contribute to marketing.
This ensured a range of perspectives on marketing visibility, from those closest to the work to adjacent roles.


