A customer scans your QR Code, completes a survey, and submits feedback. Then the response sits in a dashboard nobody checks, disconnected from the teams that could actually do something with it.
That gap is what separates feedback collection from a true feedback loop. Gathering responses is relatively easy. Turning them into measurable improvements and connecting them to broader marketing performance is much harder, especially when feedback data, analytics, and response workflows live in separate systems.
The strongest loops keep scan data, attribution, reporting, and follow-up connected within a single workflow. This guide explains how to build a QR Code feedback system that stays live, generates meaningful insights, and helps your team move from collecting feedback to acting on it.
Note: The brands and examples discussed below were found during our online research for this article.
Key takeaways
- Feedback loops work best when you use Dynamic QR Codes, because Static destinations can limit measurement, optimization, and post-print updates.
- Assigning a unique QR Code to each placement helps reveal which stores, packages, signs, or events are generating the most useful feedback.
- Strong QR feedback loops often depend on UTM parameters that connect scan data with on-page behavior, giving teams a clearer view of attribution.
- Collecting feedback is only the beginning. Closed-loop QR programs route responses to the right teams so action can follow quickly.
- When QR scan data lives alongside digital campaign data, marketers can more easily compare physical and online performance and connect insights to business outcomes.
What a real feedback loop actually looks like
A feedback loop stays open until three things happen:
- The feedback reaches your team.
- It triggers an action.
- It informs future decisions about messaging, placement, and product improvements.
Most QR Code programs handle the first part. Far fewer complete the cycle.
Here’s a simple example. Say you want to use QR Codes for customer feedback on retail store signage. You place one on wall signage and another at the checkout counter, each linking to a short customer satisfaction questionnaire.
Over time, you notice the checkout counter code generates higher scan volumes and stronger response scores. That suggests customers are more receptive at the point of purchase, so you move high-margin products closer to checkout to create more upsell opportunities. The loop closes with changes that are guided by customer feedback and measured against future results.
But the process doesn’t end with a survey response. Customer feedback drives a decision, that decision creates change, and future scans and responses help you evaluate the impact. Each cycle gives your team more context for improving the customer experience and refining future campaigns.
The five stages every closed-loop system needs
A closed-loop feedback system moves through five stages. Each stage serves a distinct purpose, and gaps at any point can make it harder to turn feedback into meaningful action.
- Trigger: A customer scans a QR Code, starting the feedback process.
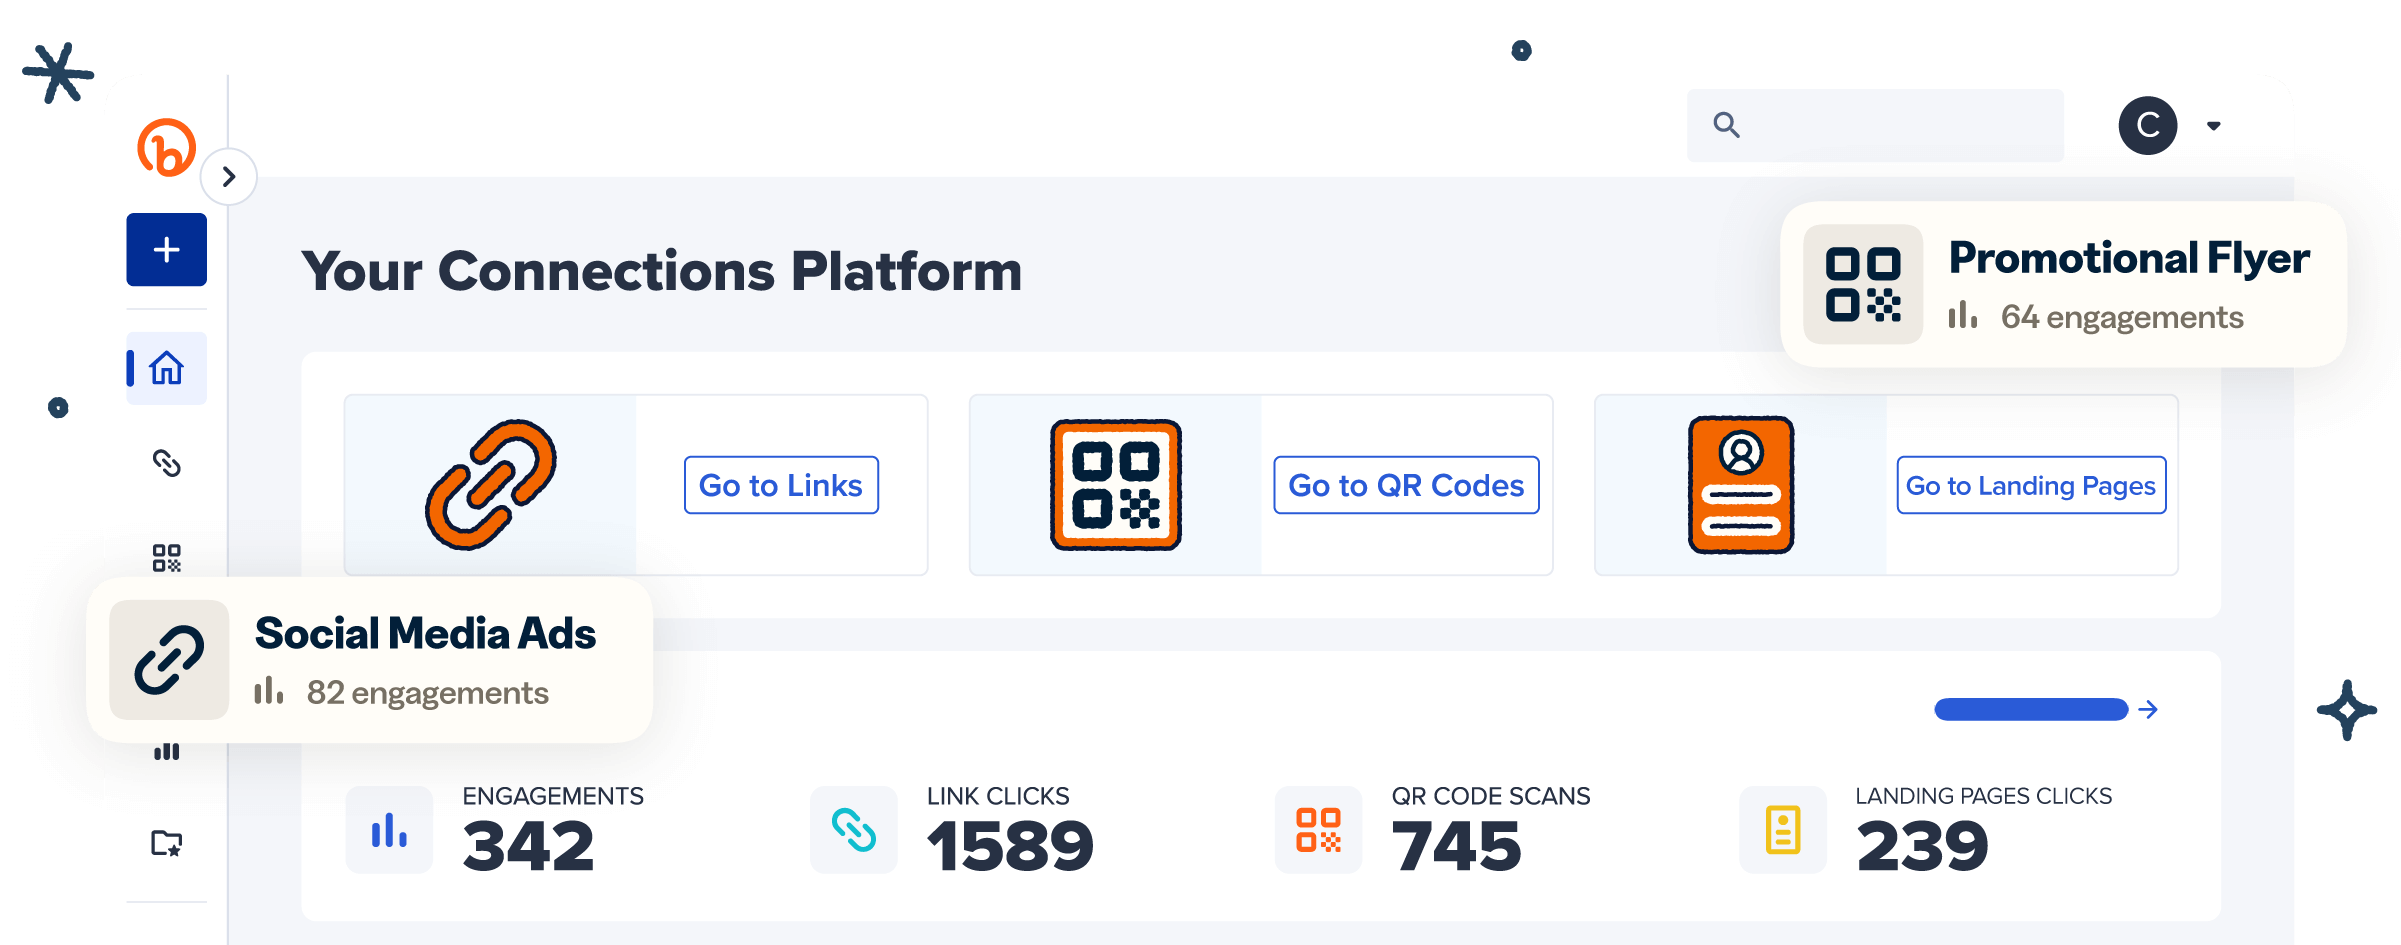
- Capture: Your tools collect data from that action. Survey platforms gather responses, while Bitly Analytics provides visibility into scan volume, engagement trends over time, location (city and country), and device data.
- Route: The information reaches the right person, department, or platform for review.
- Respond: Your team analyzes the feedback and takes action based on what they learn.
- Learn: Insights from the feedback cycle shape future messaging, placements, and campaigns, then the process begins again.
When these stages work together, feedback stops being a reporting exercise and becomes a source of ongoing optimization for campaigns, customer experiences, and business performance.
Why most QR Code feedback setups stop at stage two
Many marketing teams use QR Codes to capture scan data and route customers to online feedback forms. But what happens after submission often determines whether the program succeeds or stalls.
When feedback stalls, it’s usually an ownership problem. No one is responsible for reviewing data, so responses sit unread, and insights go unused. Without clear accountability, collecting feedback and acting on it become two completely separate events.
Downstream reporting is another common gap. When scan data and survey results aren’t regularly shared with leadership, there’s often little urgency to act—and even less incentive to improve the process. Feedback becomes a vanity metric instead of a strategic input.
A functional feedback loop requires more than good intentions. Automated workflows, consistent naming conventions, and shared reporting help keep data organized and ensure insights reach the people who can do something with them.
Static QR Codes break the loop before it starts
When adding QR Codes to your marketing materials, you have two options: Static or Dynamic. Static QR Codes lock in a destination URL at creation and can’t be changed after the code is published and distributed. Dynamic QR Codes route through a managed short link, allowing teams to update destinations without replacing printed materials.
For simple, one-time experiences, a Static QR Code may be enough. But feedback loops depend on ongoing measurement, optimization, and adaptation. As customer behavior changes and campaigns evolve, teams need the flexibility to update landing pages, refine content, and keep collecting meaningful data.
Dynamic QR Codes provide that flexibility. Because scans remain connected to a managed destination, teams can monitor scan volume, engagement trends, location, and device data while keeping campaigns live. If a survey changes, a landing page moves, or a regional version needs updating, those adjustments happen without reprinting packaging, signage, or other marketing assets.
Once printed materials are in the market, measurement gaps become expensive and difficult to fix. Dynamic QR Codes help keep feedback programs agile by allowing teams to adapt as they learn. For marketers building feedback programs, understanding these QR Code basics can help prevent challenges before they arise.
What you lose when the destination is hardcoded
The biggest limitations of a Static QR Code appear after distribution. You can point an audience to a feedback form, but if that form expires, your URL changes, or you decide to test a different survey format, there’s no way to adapt without creating a new code and replacing existing materials.
That’s a real operational risk for restaurants and retail stores that rely on QR Codes across signage, menus, and table tents. Once those materials are printed and placed, even a simple destination change can require updating physical assets.
Static QR Codes also lack built-in scan analytics, limiting visibility into scan volume and engagement trends over time. Without those insights, it’s much harder to compare placements, identify high-performing experiences, or test different survey variations.
Dynamic QR Codes as the foundation of measurable feedback
One of the biggest advantages of Dynamic QR Codes is their ability to support ongoing optimization. Whether you’re refining messaging, testing new approaches, or responding to performance trends, those adjustments can happen while the same code remains in circulation.
Keeping scans connected to live data is what makes Dynamic QR Codes a strong foundation for measurable feedback programs. With Bitly Codes and QR Code tracking in Bitly Analytics, teams can monitor scan volume, engagement trends over time, location, and device data while campaigns are still running.
Instead of waiting until a campaign ends to evaluate performance, marketers can spot emerging patterns, make informed adjustments, and improve the customer experience as new feedback arrives.
One code per placement, one source of truth
Reusing the same Dynamic QR Code across multiple placements combines data that should remain separate. When a single code appears on product packaging, shelf talkers, print ads, event signage, and other marketing materials, it becomes difficult to determine which touchpoint is actually driving scans and responses.
Assigning a unique code to each placement creates a cleaner source of truth. Audiences respond differently depending on where and how they encounter a code, and placement-level data is what reveals those differences. A QR Code on a product insert may reach existing customers after purchase, while one in a direct mail campaign may engage prospective customers earlier in the buying journey.
That level of attribution helps marketers make better decisions about budget allocation, campaign optimization, and future placements. Instead of relying on blended performance data, teams can see which touchpoints generate the strongest engagement and most useful feedback.
Why placement-level granularity changes what you can learn
Placement-level data does more than confirm which locations are busy. It helps teams understand which environments and channels are actually driving responses. National or international brands can use unique codes for each location to identify regional trends, while teams running a single campaign can compare performance across flyers, shelves, event booths, or store displays.
That level of detail makes optimization more practical. Instead of relying on total scan volume alone, marketers can identify which placements generate the strongest response rates and most valuable feedback.
The same principle applies when A/B testing QR Codes. Rather than guessing which placement resonates most, teams can run multiple options in parallel, compare scan volume and response rates, and use the results to guide future campaigns.
The fragmentation problem that kills attribution at scale
As QR Code programs grow, consistency becomes harder to maintain. Different teams may create duplicate QR Codes for the same campaign, use inconsistent naming conventions, or manage scan data in separate dashboards. The result is numbers no one fully trusts and reports that are hard to defend in budget conversations.
Available with some paid plans, Bitly’s campaign management tools can help prevent this. Teams can create dedicated campaigns with tags and preset naming conventions, keeping QR Codes and their corresponding short links organized across departments.
API access extends those capabilities further, connecting Bitly Analytics to the rest of your marketing stack so scan data doesn’t get siloed.
The two-layer attribution model for QR Code feedback campaigns
Attribution for QR Code feedback campaigns relies on two distinct analytics layers. The first captures engagement trends before a scan lands, tracked through your QR Code generator.
The second captures what happens after, including feedback collection, on-page behavior, survey completion, and downstream conversions tracked through your third-party analytics or customer relationship management (CRM) platform.
Neither layer tells the full story alone, but together, they turn a feedback QR Code into a more accountable campaign asset. Looking at both layers helps marketers understand where engagement originates and whether audiences take the actions the campaign was designed to drive.
Layer one: What your QR Code platform captures before the scan lands
Before anyone fills out a survey or visits a landing page, your QR Code platform is already collecting data. With Bitly Analytics, teams can monitor scan volume, engagement trends over time, location (city/country), and device data to understand which placements are attracting attention.
Those signals are actionable while campaigns are still running. If one placement generates significantly more scans than others, that’s a cue to replicate what’s working, whether it’s the physical location, surrounding creative, or call-to-action (CTA) encouraging people to scan.
Layer two: What your analytics platform captures after
Once a visitor reaches the destination, your analytics platform or CRM takes over. Metrics like completion rates, average session length, and post-survey conversions reveal what audiences actually do after they arrive—context your QR Code platform alone can’t provide.
This is where the two layers earn their value together. High scan volume paired with low survey response rates, for example, often points to a destination experience problem, such as a survey that isn’t mobile-friendly, a page that loads slowly, or a question that causes drop-off. Without layer two, that gap stays invisible.
How UTM parameters connect both layers into one view
UTM parameters connect scan data and post-scan behavior into a single reporting view. By adding UTM parameters to your destination URL before generating the QR Code, traffic from physical placements becomes visible inside tools like Google Analytics, alongside the rest of your channel data.
For QR Code feedback campaigns, use utm_medium=qr consistently across all placements, so QR-driven traffic stays identifiable. Vary utm_source and utm_content by placement to preserve the granularity you built in layer one.
For example, a code on in-store signage might use:
https://yourwebsite.com/survey?utm_medium=qr&utm_source=store_signage&utm_content=checkout_display
while a code on product packaging could use:
https://yourwebsite.com/survey?utm_medium=qr&utm_source=packaging&utm_content=product_insert
In this example, utm_source identifies where the scan originated, while utm_content distinguishes the specific asset.
Closing the loop means routing feedback to the right destination
Collecting responses is the easy part. The loop only closes when the right team receives the feedback quickly enough to act on it.
Automated workflows and alerts are the most reliable way to make that happen. When feedback routes to the right person automatically, it can be addressed while the context is still fresh, rather than sitting in a dashboard waiting for someone to go looking for it.
Designing response workflows that act on what customers say
Before your first survey launches, establish clear guidelines for where each type of feedback should go. Negative feedback can route to customer service, product issue reports to operations, and positive feedback to lifecycle or advocacy teams. The goal is to reduce the time between customer input and action so issues get resolved quickly, reinforcing a positive experience.
Natural language processing tools can analyze and sort incoming responses automatically, while automation tools like Zapier handle the routing. Set up alerts so teams know when new feedback arrives and can act without delay.
Zero-party data versus first-party data in a feedback system
Zero-party data is what your audience voluntarily shares, including survey responses, product ratings, and direct comments. First-party data is behavioral, including scan activity and engagement data collected through your QR Codes and other owned marketing assets.
Both matter. Stated feedback tells you what your customers think, while behavior data shows what they actually do. Used together, they support more accurate segmentation, better follow-up timing, and smarter campaign decisions. Comparing the two can also reveal where customer perceptions and customer behavior diverge, creating opportunities for further investigation.
The revenue attribution gap and how to close it
Scan volume is easy to report. Proving that QR Code surveys influenced pipeline, purchases, or retention is harder—and that’s the question leadership actually wants answered before expanding a program.
The gap is operational, not inevitable. Start by connecting scan activity, survey engagement, and business outcomes at the campaign level, then build attribution models using revenue estimates.
For example, a retailer might compare customer satisfaction scores before and after a store-level initiative, then measure whether those locations also experienced stronger retention or higher repeat purchase rates. As your data governance matures, teams can connect individual feedback touchpoints to CRM outcomes and measurable business impact.
Why many marketers expect revenue impact, but only a small percentage can prove it
The most common reason QR Code campaign results are hard to defend isn’t strategy, it’s infrastructure. Collecting engagement data is relatively straightforward. Connecting that engagement to business performance is a much bigger challenge.
The problem is widespread: 77% of business professionals say data silos hinder their ability to make data-driven decisions, and 83% say they undermine innovation. For QR programs, that fragmentation means leadership rarely sees the full picture—and you’ll rarely get funds for expansion based on scan counts alone.
Closing the gap means integrating systems and building reports that connect QR Code activity to business outcomes. Campaign-level cause and effect, surfaced regularly, is what turns a feedback program into a budget-worthy investment.
Build feedback loops that stay live and keep delivering
A successful QR Code feedback program depends on more than collecting responses. To generate meaningful insights and improve outcomes over time, teams need measurement, attribution, and response workflows that keep insights connected to action.
High-performing teams don’t stop at collecting feedback. They continuously use customer input to refine experiences, improve campaign performance, and guide future decisions.
Bitly makes it easier to build and optimize that infrastructure from one place. Create custom Dynamic QR Codes with your brand colors and logo, organize them with campaign tagging, and track scan volume, engagement trends, location, and device data in real time with Bitly Analytics.
When your codes, data, and reporting work together, it’s easier to understand what’s driving results and where to improve next.
Ready to build a more measurable QR Code feedback program? Explore Bitly’s plans to find the tools that fit your team.
FAQs
How do QR Codes create a feedback loop with customers?
A QR feedback loop starts when a customer scans a code, shares input, and triggers a response from the right team. The loop closes when you act on that feedback, improve the experience, and measure whether scans, sentiment, or conversions improve over time.
What’s the difference between Static and Dynamic QR Codes for feedback loops?
Static QR Codes lock in one destination, so you can’t update the experience or access scan data after printing. Dynamic QR Codes route through a managed link, which may help you track scans, update destinations, and keep the feedback loop live.
How do you track QR Code scans in a marketing dashboard?
Use a Dynamic QR Code with consistent UTM parameters, then connect scan data and on-site behavior inside one reporting view. Bitly Analytics helps you see pre-scan details like location and device, while your web analytics shows what happened after the landing page loaded.
Why should you use one QR Code per placement?
One code per placement preserves source data, so you can compare stores, mailers, booths, or packages without muddying attribution. That granularity may help your team identify stronger creative, faster response needs, and operational issues before they affect campaign performance.
How do you connect QR Code feedback to revenue outcomes?
Start by tying each feedback QR Code to campaign tags, destination analytics, and a CRM record or conversion event. With Bitly Codes and Bitly Analytics, it’s easier to connect engagement data with broader business outcomes and share those insights across teams.