
You know what they say about first impressions—you might only have one chance to get it right. But how do you truly gauge how your business or brand might come across to your audience? Like a nerve-wracking first date or an important job interview, apart from directly asking, it can be hard to know. Luckily, when it comes to making a great first impression on potential customers both online and offline, businesses can access a wealth of data to paint a clearer picture.
For both B2B and B2C brands, top-of-funnel (TOFU) analytics stand as an essential part of your marketing playbook. They tell you if you’re knocking it out of the park from the first time someone learns about your brand or if your ideal customers are actually tuning you out.
Let’s do a deep dive into what top-of-funnel analytics are, how you can use them to measure your marketing impact, and explore some budget-friendly tools Bitly Analytics can help you connect with your audience right from the get-go.
Key takeaways
- Top-of-funnel metrics measure how effectively you attract and engage new audiences before they ever enter your sales pipeline.
- The most important TOFU metrics to track include impressions, reach, website traffic, engagement rate, and click-through rate.
- Connecting TOFU data to downstream conversions is the key to proving that your awareness campaigns are actually driving revenue.
- Link-level analytics give you granular visibility into which top-of-funnel touchpoints drive the most clicks and engagement—and Bitly Analytics makes that tracking effortless.
What are top-of-funnel metrics?
Top-of-funnel metrics are the data points that measure how effectively your brand attracts and engages new audiences at the earliest stage of the customer journey—the awareness stage. For more than a century, the marketing world has used a funnel to describe the journey a typical customer takes when deciding to buy a product. Starting from the top and then moving your way down the bottom, a traditional marketing funnel looks like this:
- The top of the funnel (TOFU) is the earliest stage. This is where the broadest audience exists and where individuals typically become aware of a problem or need they face. Ideally, they’ll later discover that your product or service can provide the solution.
- The middle of the funnel (MOFU) comes next. Here, brands try to educate customers and build relationships with them to bring them closer to purchasing over time.
- Finally, customers that stick with you reach the bottom of the funnel (BOFU). At this stage, brands might offer discounts or showcase what sets their product apart from competitors to help customers make the final decision to purchase.
All parts of the conversion funnel help you move someone from not knowing your brand exists to becoming a loyal customer. But if your TOFU tactics don’t cut it, your audience’s journey will be over before it even starts. That’s why it’s so important to measure engagement with your brand early on in the customer journey—and that’s where TOFU metrics come in.
Understanding your audience’s behavior empowers your brand to allocate time and resources to the channels they prefer to engage with the most. Here are some key TOFU metrics every business should start tracking if you aren’t already:
- Unique website visits and pageviews
- Session lengths
- Link clicks from referring pages and click-through rates
- QR Code scans from a package or in-store display
- Social media impressions and engagement
When you know how your audience engages with your brand thanks to insightful data, you’ll be able to make even stronger, more memorable connections with them.
Essential top-of-funnel metrics to track
Now that you know what top-of-funnel metrics are and why they matter, let’s get specific. Here are the TOFU metrics that deserve a spot on your reporting dashboard.
Impressions and reach
Impressions tell you how many times your content was displayed, while reach counts the number of unique people who saw it. Together, they answer a fundamental question: how big is the audience your campaigns are actually touching?
- High impressions, low reach: You’re hitting the same people repeatedly—useful for retargeting but not ideal at the awareness stage.
- High reach, low impressions: Your content is spreading widely but may need more frequency to stick.
Website traffic and time on page
Getting people to your site is the first win. Total visits and unique visitors show you whether your awareness efforts are driving real interest.
- Time on page: Reveals whether visitors are actually engaging with your content or bouncing after a quick glance.
- High traffic with low time on page: A signal to revisit your messaging or content quality.
Click-through rate (CTR)
CTR measures the percentage of people who see your content and take action by clicking. It’s one of the clearest indicators that your message is resonating with your audience.
- Cross-channel tracking: Compare CTR across ads, social posts, and emails to find which creative and copy combinations perform best.
- Link-level measurement: Tools like Bitly Links make it easy to measure click-through rates on every link you share.
Engagement rate
Engagement rate captures likes, comments, shares, saves, and other interactions relative to your total audience. It’s a strong signal of content relevance—people don’t engage with things they don’t find valuable. A rising engagement rate at the top of the funnel usually means your brand message is landing well with new audiences.
Brand awareness and lift
Brand awareness metrics measure whether people recognize and recall your brand. Brand lift studies—often available through ad platforms—compare awareness levels between people who saw your campaign and those who didn’t. These metrics are especially valuable for leadership conversations because they directly quantify the impact of awareness spending.
Video completion rate
If video is part of your TOFU strategy, completion rate tells you how many viewers watched all the way through. A high completion rate means your content is holding attention, which is no small feat in a scroll-heavy world.
- Low completion rates may signal: Videos that are too long, too slow to hook, or reaching the wrong audience.
3 ways top-of-funnel data helps you win
Just knowing how many people visit your website or follow your brand on social media isn’t enough to grow your business. TOFU metrics go deeper—they help you learn both how people engage and why they choose your brand.
1. They help you understand early audience interactions
First impressions matter. They can form the foundation of a relationship with a potential customer or turn someone off from your brand for good. You need TOFU metrics to understand how your messaging comes across from the get-go. Knowing why people buy makes all the difference in optimizing your marketing efforts.
What was it about your product, branding, or messaging that spoke to your customers and inspired them to take an initial action like clicking a link or scanning a QR Code? Was it your company values, a convenient purchase experience, a playful or funny brand voice, or a truly unique product? By learning what love at first click looks like for your customers, you can drill down into what sets your brand apart through the entire customer journey.
2. They give you a sense of your brand’s presence
With so many marketing channels to manage and new competitors emerging constantly, it can be hard to gauge how your brand is resonating. TOFU metrics show you how well you’re cutting through the noise and reaching the customers who matter most.
How much awareness do you have among the demographics that tend to buy from you? How often do they click through when they encounter your brand both online and offline? Answer these questions by keeping a close eye on your engagement and click-through rates. You’ll learn what resonates with customers, where you should invest more, and what your target audience wants to see.
Over time, as you make changes to your products, offerings, website, and calls to action, TOFU data shows you how you stack up against your competitors and how effectively you capture attention from the very first impression.
3. They teach you why people buy from you
High-performing marketing teams understand their customers inside and out—starting at the top of the funnel, because even the first click can tell a story about why someone eventually makes a purchase.
For small businesses or marketers with limited budgets, robust analytics platforms can feel out of reach. But accessing and understanding TOFU data doesn’t have to break the bank or require specialized expertise.
With targeted campaigns, thoughtful A/B tests, and analytics dashboards that give you in-depth insights at a glance, you can dive deep into the minds of your customers. Learn what appeals to them, understand what leads them to buy, and tailor your marketing accordingly.
Gather TOFU insights with Bitly Analytics
If you want to make meaningful, measurable connections with your audience across every interaction, then Bitly is your best friend. With trimmed, trustworthy short links and simple, scannable QR Codes, connecting with your customers both online and offline has never been easier. And now, with Bitly Analytics, tracking and analyzing all your key TOFU metrics across every customer touchpoint is as simple as pie.
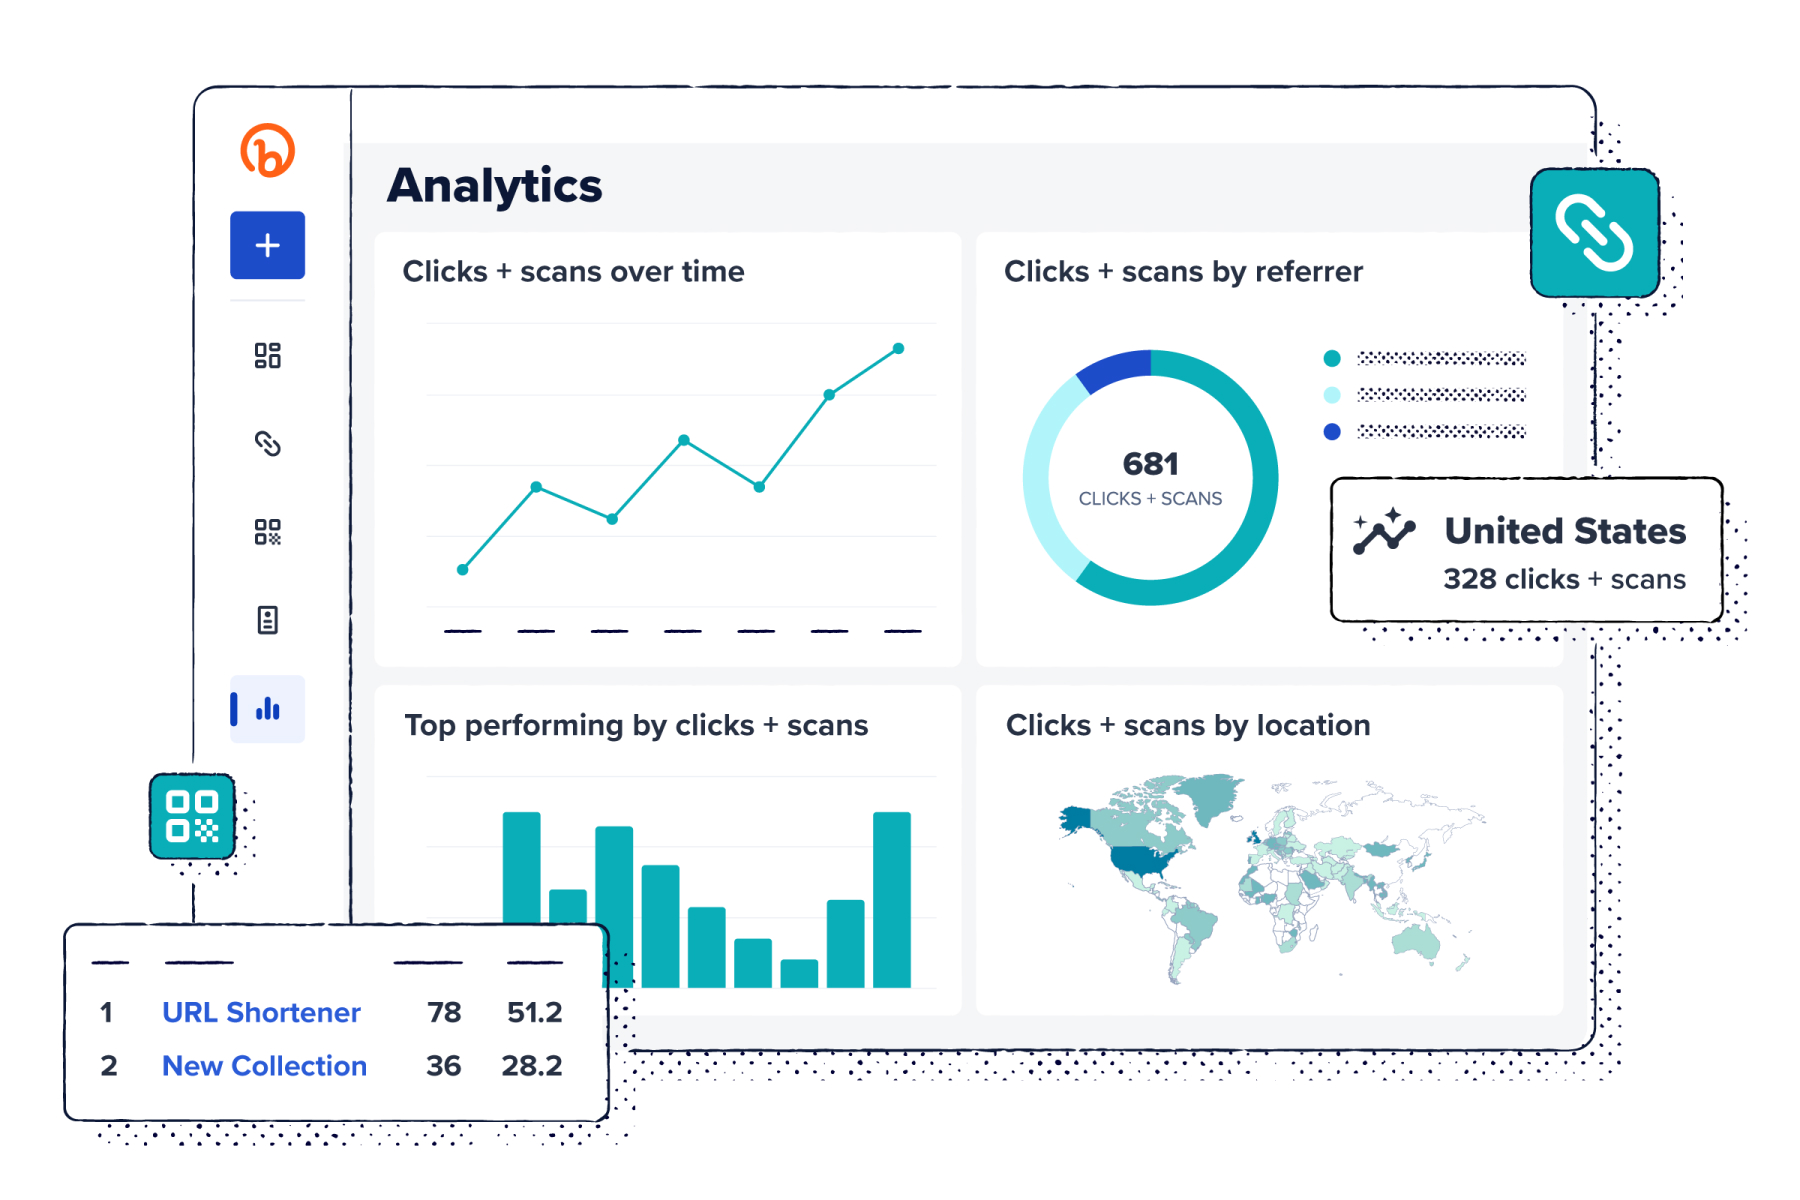
Armed with audience insights and high-level performance across channels—plus the same deep-dive data on individual links and codes you’ve always known and loved—marketers can now quickly capture big-picture data trends in real time. Bitly Analytics gives you key top-of-funnel metrics like:
- Your top-performing QR Codes and Bitly Links by clicks and scans
- Clicks and scans by location
- Clicks and scans by referrer
- Clicks and scans over time
Analyze your audience’s behavior, report on results, and refine your marketing efforts to optimize your impact. With Bitly Analytics, you now have a powerful look at how your campaigns are performing, all from one central location.
When it comes to analyzing TOFU engagement, your goal should be to uncover when, where, and how your audience initially interacts with your brand. One of the best ways to consistently collect that information is by using UTM links, which let you capture detailed information about where your clicks come from.
- How UTM links work: Include key bits of information such as the source, content, or campaign associated with each link (these are called UTM parameters) to uncover audience insights across every link you share.
You can create UTM links right from within the Bitly Connections Platform. Create a Bitly Link or QR Code as you normally would, and simply add in UTM parameters so you can see where all your clicks and scans are coming from.
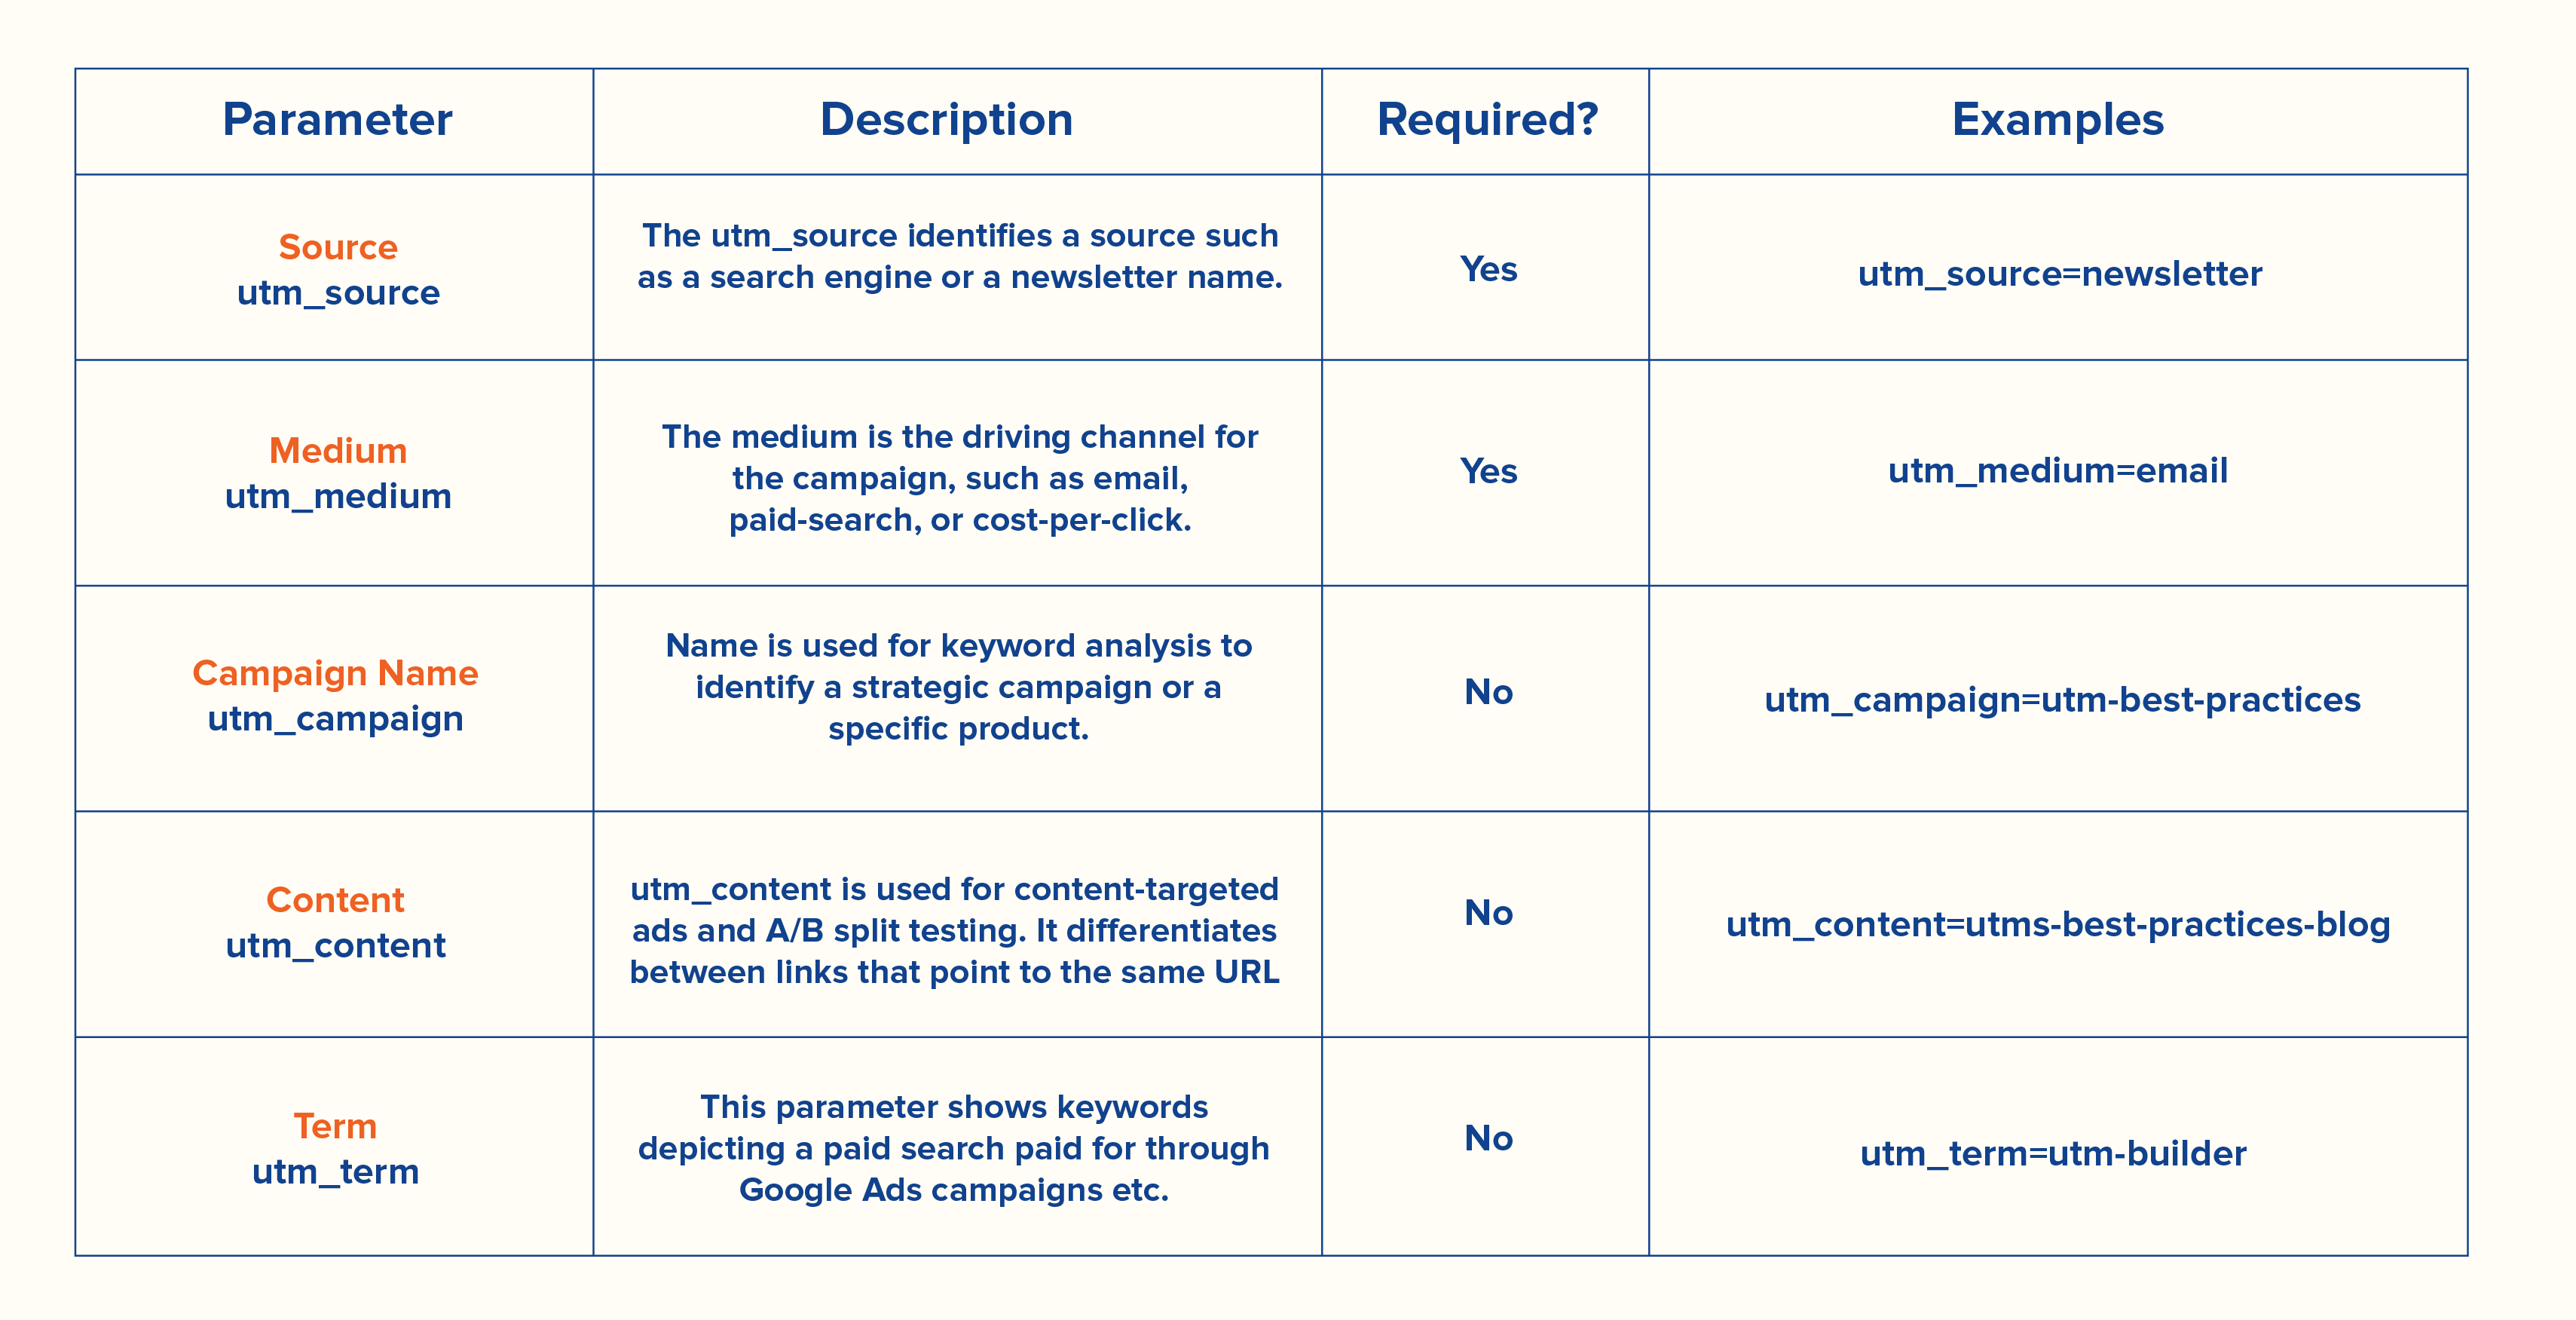
Here’s a helpful table with examples of UTM parameters for reference.
Once those clicks and scans start rolling in, you can easily see how they are all performing in Bitly Analytics. Hone in on the social media channels or devices that your audience uses most often and then allocate your resources to campaigns that are already taking off (or fix the ones that aren’t yet).
A/B testing—which involves comparing two versions of a campaign with segments of your audience to determine the better performer—remains an incredibly helpful tool for marketers. It’s especially useful for learning which messaging or calls-to-action appeal to your audience most. Plus, it’s a great way to refine your top-of-funnel interactions.
If you’re using Bitly Links on a new social media channel or even adding QR Codes to product packaging, Bitly Analytics will help you understand performance right away. The dashboard shows spikes in overall engagement across your campaigns in real time—and from there, you can dig deeper to see which TOFU channels are performing best and invest in them strategically.
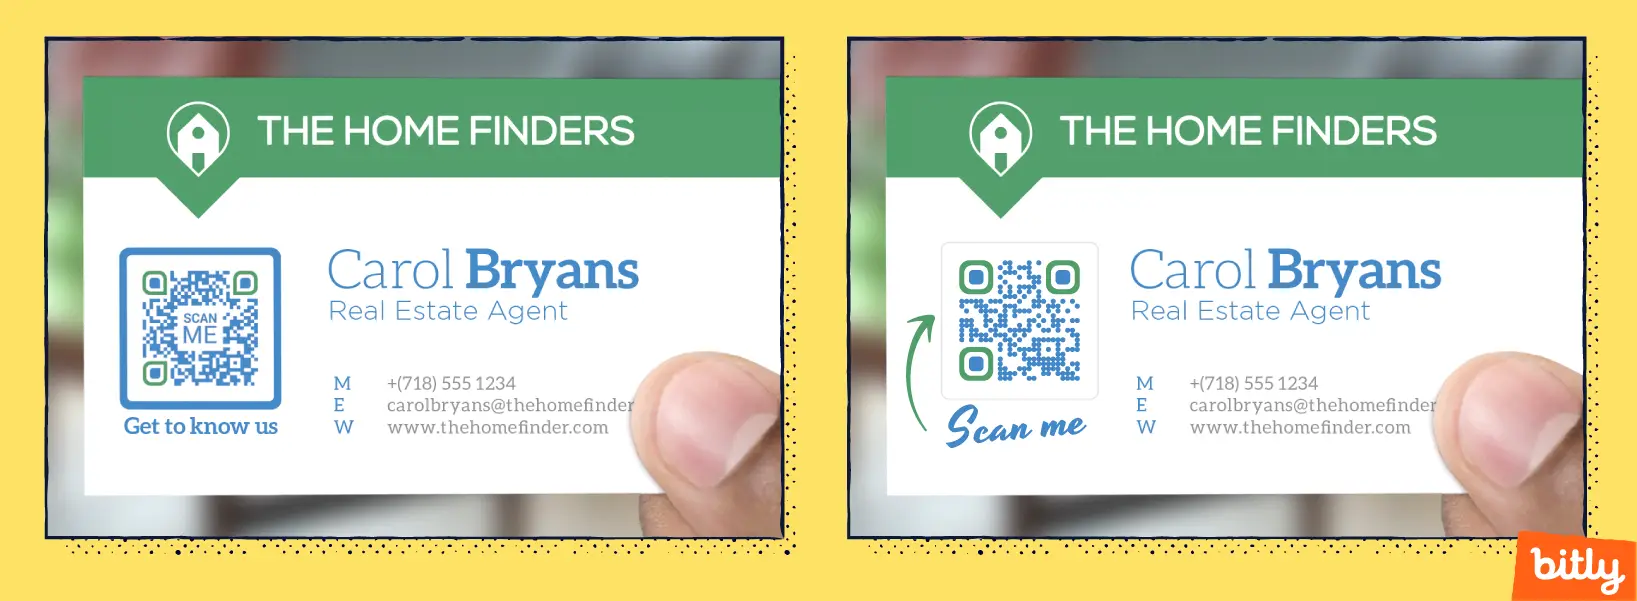
Test out two different versions of a business card like the one above and monitor scans.
Frequently Asked Questions about top-of-funnel metrics
What are top-of-funnel metrics?
Top-of-funnel metrics are the data points that measure how well your brand reaches and engages new audiences at the awareness stage. Common examples include impressions, reach, website traffic, engagement rate, and click-through rate. These metrics help you understand whether your campaigns are generating visibility and interest before prospects move deeper into the funnel.
What are the key metrics at each stage of the marketing funnel?
At the top of the funnel, focus on impressions, reach, and brand awareness. In the middle of the funnel, track leads, email signups, and engagement depth. At the bottom, measure conversions, sales, and customer acquisition cost. Each stage has its own set of metrics because the goals shift from awareness to consideration to action.
What are upper-funnel brand metrics?
Upper-funnel brand metrics specifically measure brand visibility and perception. The most common ones include brand awareness lift, share of voice, branded search volume, and social mentions. These metrics help you quantify how well your brand is registering with your target audience—even before they visit your website or engage with your content directly.
How do you connect top-of-funnel metrics to revenue?
The best approach is to use UTM-tagged links and multi-touch attribution to trace how awareness-stage touchpoints contribute to downstream conversions. Bitly Links make this straightforward—you can track clicks from TOFU campaigns all the way through to purchase, giving you a clearer picture of which awareness efforts are actually driving ROI.
What is the difference between top-of-funnel and bottom-of-funnel metrics?
Top-of-funnel metrics measure reach and awareness—things like impressions, traffic, and engagement. Bottom-of-funnel metrics measure action and revenue—conversions, sales, and customer lifetime value. Both are essential to a healthy marketing strategy. TOFU fills the pipeline with potential customers, and BOFU closes them.
From top-of-funnel data to bottom-line impact
Tapping into top-of-funnel data is the key to understanding your customers before you try to convince them to buy your product or sign up for your service. The more effective your TOFU marketing and messaging are, the more likely it is that people will move through the rest of the funnel to become long-term customers.
That’s why you need real-time, big-picture data to understand how your efforts are performing and make critical improvements that grow the group of people who’ll become raving fans. Bitly is here to help you build lasting connections with your customers thanks to the all-in-one Bitly Connections Platform—and with Bitly Analytics, you have all the data you need to maximize your engagement and impact.


