Modern marketers have their finger on the pulse when it comes to digital marketing channels—and for good reason! They’re highly measurable, there are endless platforms to choose from, and the potential reach is massive. But savvy marketers know that traditional “offline” marketing channels are incredibly powerful, too. Direct mail, a strategically placed flier, or even a captivating billboard can pack a huge punch when executed well. It’s not easy to leave a lasting impression on someone and encourage action, but many offline marketing campaigns do just that!
Even the best offline marketing campaigns, however, can be notoriously challenging to measure. How do you understand the impact of a static asset outside of digital platforms? Can you make the case for investing in other offline marketing campaigns if you can’t prove your return on investment?
Luckily, tools like QR Codes and Short Links are turning the tide. By adding these trackable elements to offline campaign assets, marketers can easily measure customer engagement and directly attribute performance down to an individual asset. With more data in your back pocket, you can understand the impact of your offline efforts and tailor your future strategies accordingly. Let’s explore how tools like Bitly Analytics can help and check out some offline marketing examples to inspire your next campaign.
The challenge of offline marketing campaigns
It’s no big secret—in the marketing world, measuring offline channels has always been a hard nut to crack. Whether you ran a billboard advertisement in a big city or sent out direct mail to customers, getting precise data on how well those offline strategies performed was a daunting task. Who visited your store after spotting the billboard? Who purchased after seeing your flier in the mail?
As digital marketing surged ahead at light-speed since the early 2000s, its measurability became a standout feature for marketers hungry for data. From digital advertising and social media engagement to email performance and content marketing, marketers could suddenly tap into audience data to improve their campaigns on the fly and understand their business impact.
While digital marketing changed the world as we know it, the power of offline marketing channels still shines through (and when you tap into omnichannel marketing strategies that combine both offline and online interactions, that’s where the magic really happens). So, how can marketers make their offline marketing efforts work harder and see results that are even more measurable? Thanks to technology like QR Codes and Short Links, marketers now have the means to connect with their audiences and understand their offline marketing performance like never before.
Offline marketing tactics you can actually track
Not long ago, an outdoor advertisement might prompt viewers to visit a brand’s website, but marketers wouldn’t be able to pinpoint that traffic to any particular advertisement. Another challenge? They had to convince busy people to type a lengthy URL into their internet browsers to explore more.
With a unique QR Code or Short Link printed directly on an advertisement, pamphlet, or brochure, marketing teams can now see exactly how their print campaigns are performing, from how much traffic they’re driving to where geographically those engagements are coming from. They can also improve future campaigns based on which CTAs, discounts, or offerings resonate most with their audience. Better yet, they can test out different versions of their campaign creative and actually measure which variation was most successful at driving the desired outcome based on their goals.

This is a game-changer for small businesses, too, because these solutions aren’t just trackable. They’re also affordable ways to turn their outdoor fliers, direct mail, or even window displays into more measurable channels for connecting with their audiences.
How Bitly Analytics powers marketing measurement
If you’ve already been using Bitly’s QR Codes and Short Links, you probably know you can track an individual campaign’s performance over time. But now with Bitly Analytics, you can take tracking and optimizing your marketing efforts to the next level.
Our dashboard gives you big-picture analytics across all of your scans and clicks so you can quickly review results across the board. Learn about your audience, understand their behavior, and improve your QR Codes and Short Link placements—all from one central location.
With real-time data from offline and online marketing channels, Bitly Analytics helps you optimize your marketing efforts across every audience interaction. For teams already using Adobe’s reporting tools, the Bitly and Adobe Analytics integration sends QR Code scan and link click data directly into Adobe dashboards, connecting offline engagement to your broader campaign reporting.
How to measure offline marketing campaigns
When you’re measuring offline marketing campaigns, a real-time data dashboard like Bitly Analytics makes it easier than ever to understand performance and get better results. Let’s explore some of the data available in Bitly Analytics and how it can help you measure your offline marketing efforts.
1. Performance over time
While Bitly has always offered a view of individual QR Code and Short Link performance (like the number of scans one QR Code receives or clicks on a Short Link), the new Bitly Analytics dashboard lets you view aggregate results across all of your campaigns. You can customize your view by filtering the data so you only see clicks and scans for a select number of links—up to 100 at a time! To add an extra layer of granularity, filter your dashboard by date so you can track changes in performance over time.
Let’s say your business is running a promotional campaign this summer and you’re using QR Codes and Short Links across a number of different assets. You can now see how scans and click-through rates are tracked during specific periods of time and use these insights to inform future engagement strategies across your marketing efforts. Optimization is the name of the game!
2. Location
Use real-time location data to uncover how offline engagements translate to online actions. Are you seeing a surge in traffic from a particular country, signaling an opportunity to ramp up your advertising efforts? Or perhaps there’s an unexpected city where shoppers can’t seem to get enough of your products?
You can use Bitly Analytics to pinpoint regions that are showing an increase in clicks or scans and drill down to see which materials—like store signage or fliers—are driving the most action. This information can help inform future targeted online ad campaign placements or even localized content strategies tailored to tap into geographical interest areas.
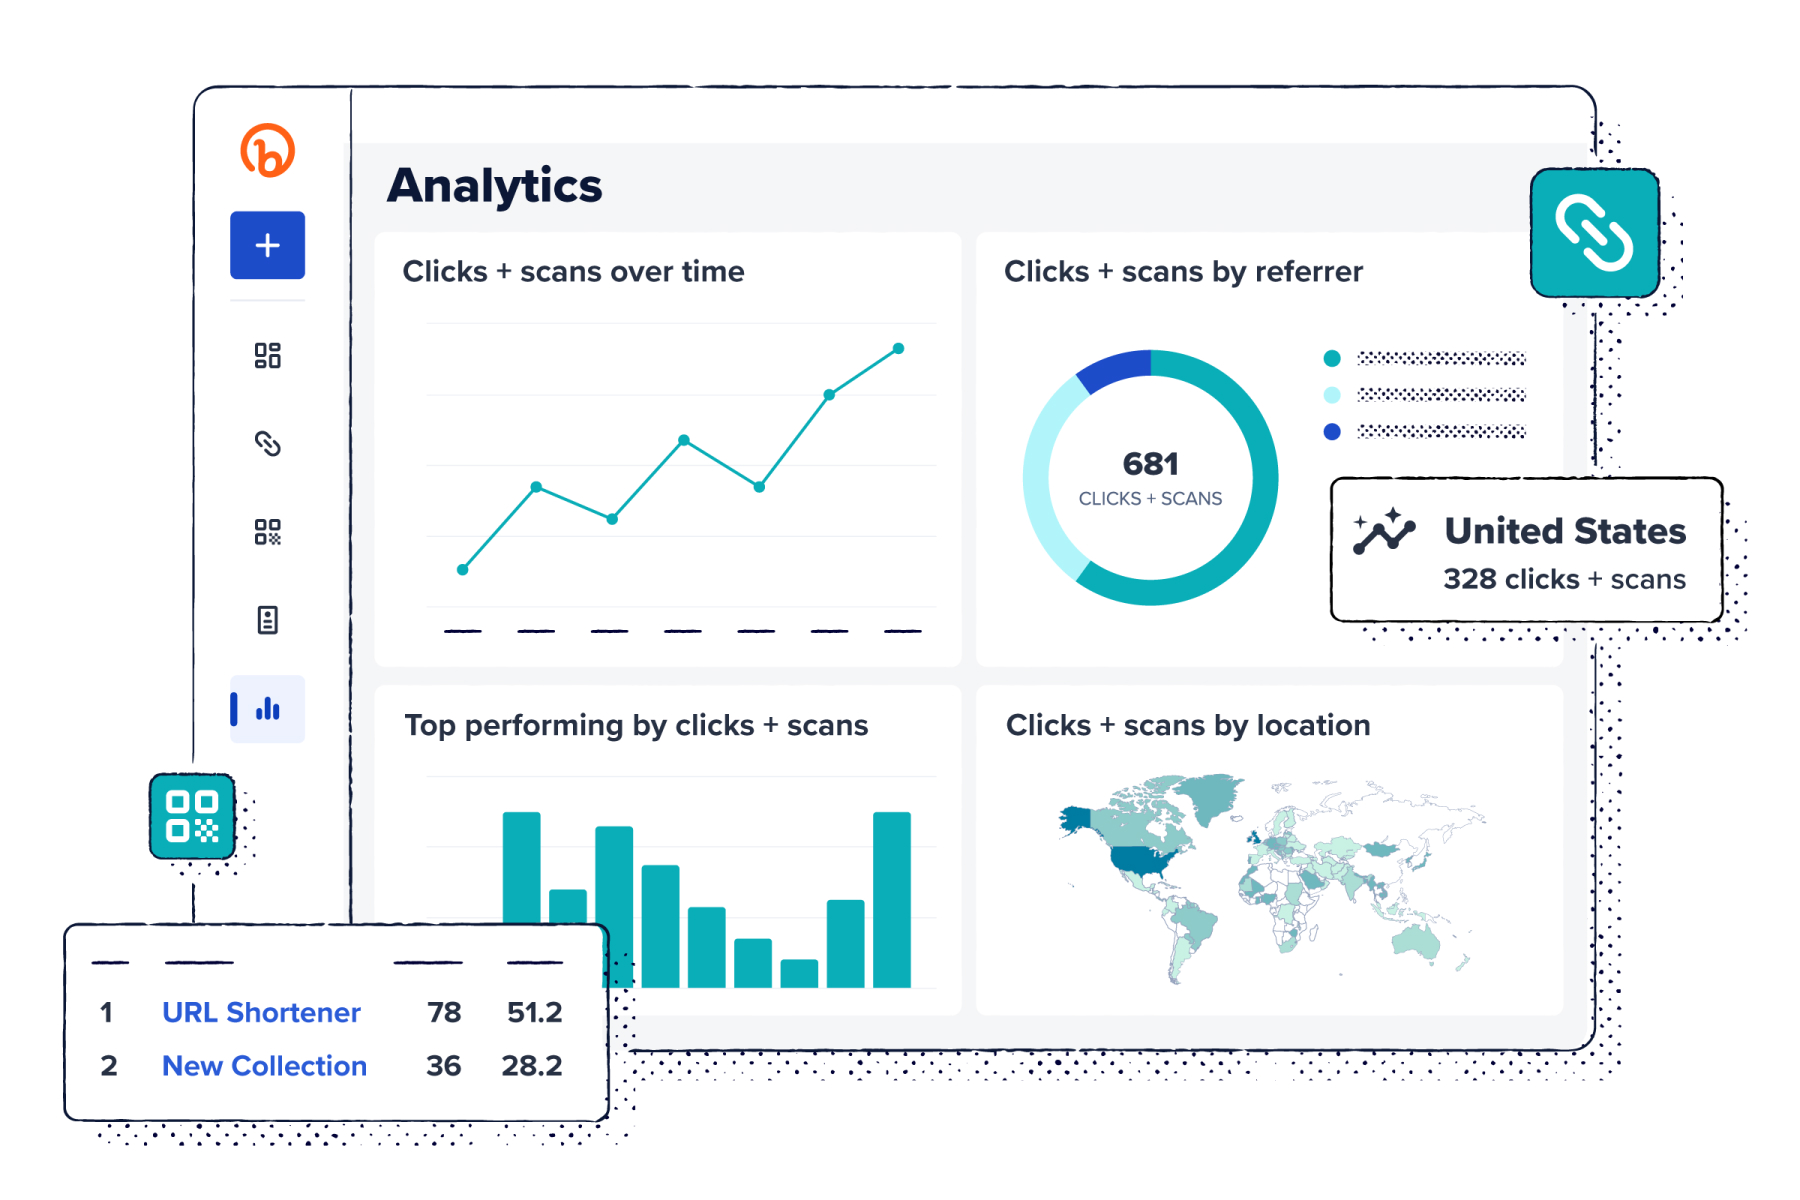
3. Website referrers
On top of the physical location for each click and scan, you can also dig into how your audience found you in the first place—this matters for offline and online campaigns. With Bitly Analytics, you now have access to comprehensive insights into the online journey from offline engagements like brochures or advertisements.
Use this data to identify which specific offline channels effectively drive users to your website. For instance, you can find out whether a particular asset consistently boosts traffic to your online properties—and which ones might not be moving the needle. Website referral data highlights the channels and tactics that strike a chord with your audience, giving you intel on where to potentially increase your marketing efforts.
4. Devices
Bitly users with Premium plans can delve into click and scan data by device types after your audience has engaged with your offline materials like brochures or storage signage. At a glance, you can learn which device types your audience members use most to engage with your brand. Then, turn those insights into action by optimizing your digital experiences and ensuring a seamless transition from offline-to-online touchpoints.
Bonus! Data displays for days
If you aren’t sure where to start, don’t stress! Within Bitly Analytics, you’ll see preset dashboards with key charts already populated with data so you can start digging into the numbers today. Download the charts themselves or export all the raw data as a .CSV file so you can analyze or manipulate it further depending on your needs.
Not only can you review and report on your marketing campaigns from multiple angles, but you can also visualize results in the chart type that best matches the data:
- Line: The line format is a great way to display performance over time, showing peaks, dips, and progress. This chart type lets you directly connect your marketing efforts to positive results.
- Table: Sometimes, the numbers speak for themselves, and the table format lets the data take center stage. Use a table to rank top-performing short links or scans, share performance over time, or list top locations by the numbers and by overall percentage.
- Donut: For your next data reporting presentation, use the donut chart for a colorful breakdown of your website referrers or device types, and show how big a slice of the pie each channel is taking.
- Bar chart: Use a classic bar chart to break down top-performing links or QR Codes or which channels drove the most traffic.
- Scorecard: Some stats are so insightful that you have to give them their own moment in the spotlight. With the scorecard module, you can highlight key findings like high-traffic weeks and how many clicks came in, or call out spikes in performance around key events.
- Map: The map data display is a great way for international brands to show how the locations of their traffic, scans, and clicks are distributed around the world. In reporting presentations, the heat map provides a clear, memorable visual for your audience.
Mix and match all of these modules in Bitly Analytics for a full picture of how your QR Codes and Short Links are performing. When you know how your marketing campaigns are stacking up, you have the tools to drive better results.
4 measurable offline marketing examples
Measurable marketing tactics are the secret to turning offline campaigns into a treasure trove of audience data (and action!). And now, Bitly Analytics puts all of that data in one place so you can report on the impact of your marketing efforts and optimize every campaign.
Here are a few examples of offline marketing campaigns that use QR Codes and Short Links to drive measurable results so you can get inspired to make it happen across your marketing campaigns, too.
1. Smalls: Driving traffic with a subway campaign
Cat food brand Smalls offers feline-friendly cuisine delivered straight to doorsteps across the country. To reach New York City audiences, the Smalls team placed playful ads across the NYC subway system—and with Bitly QR Codes, they didn’t have to guess how these out-of-home advertisements performed.

Smalls used Bitly QR Codes on each ad to give curious cat owners a simple way to learn more or order instantly. Rather than having to type in a URL or search for Smalls on Google, subway riders could simply scan the code on the go. The brand could then see exactly how many cat parents took action and engaged with the quirky campaign.
HOW BITLY ANALYTICS CAN HELP
With a single source of truth and one easy-to-use dashboard, brands like Smalls can see performance across all of their offline marketing campaigns at a glance. Uncover how scans (and clicks) have increased or decreased over time and then make a game plan for future campaigns! Plus, you can easily export a variety of charts and graphs from within Bitly Analytics to add to your next performance read-out.
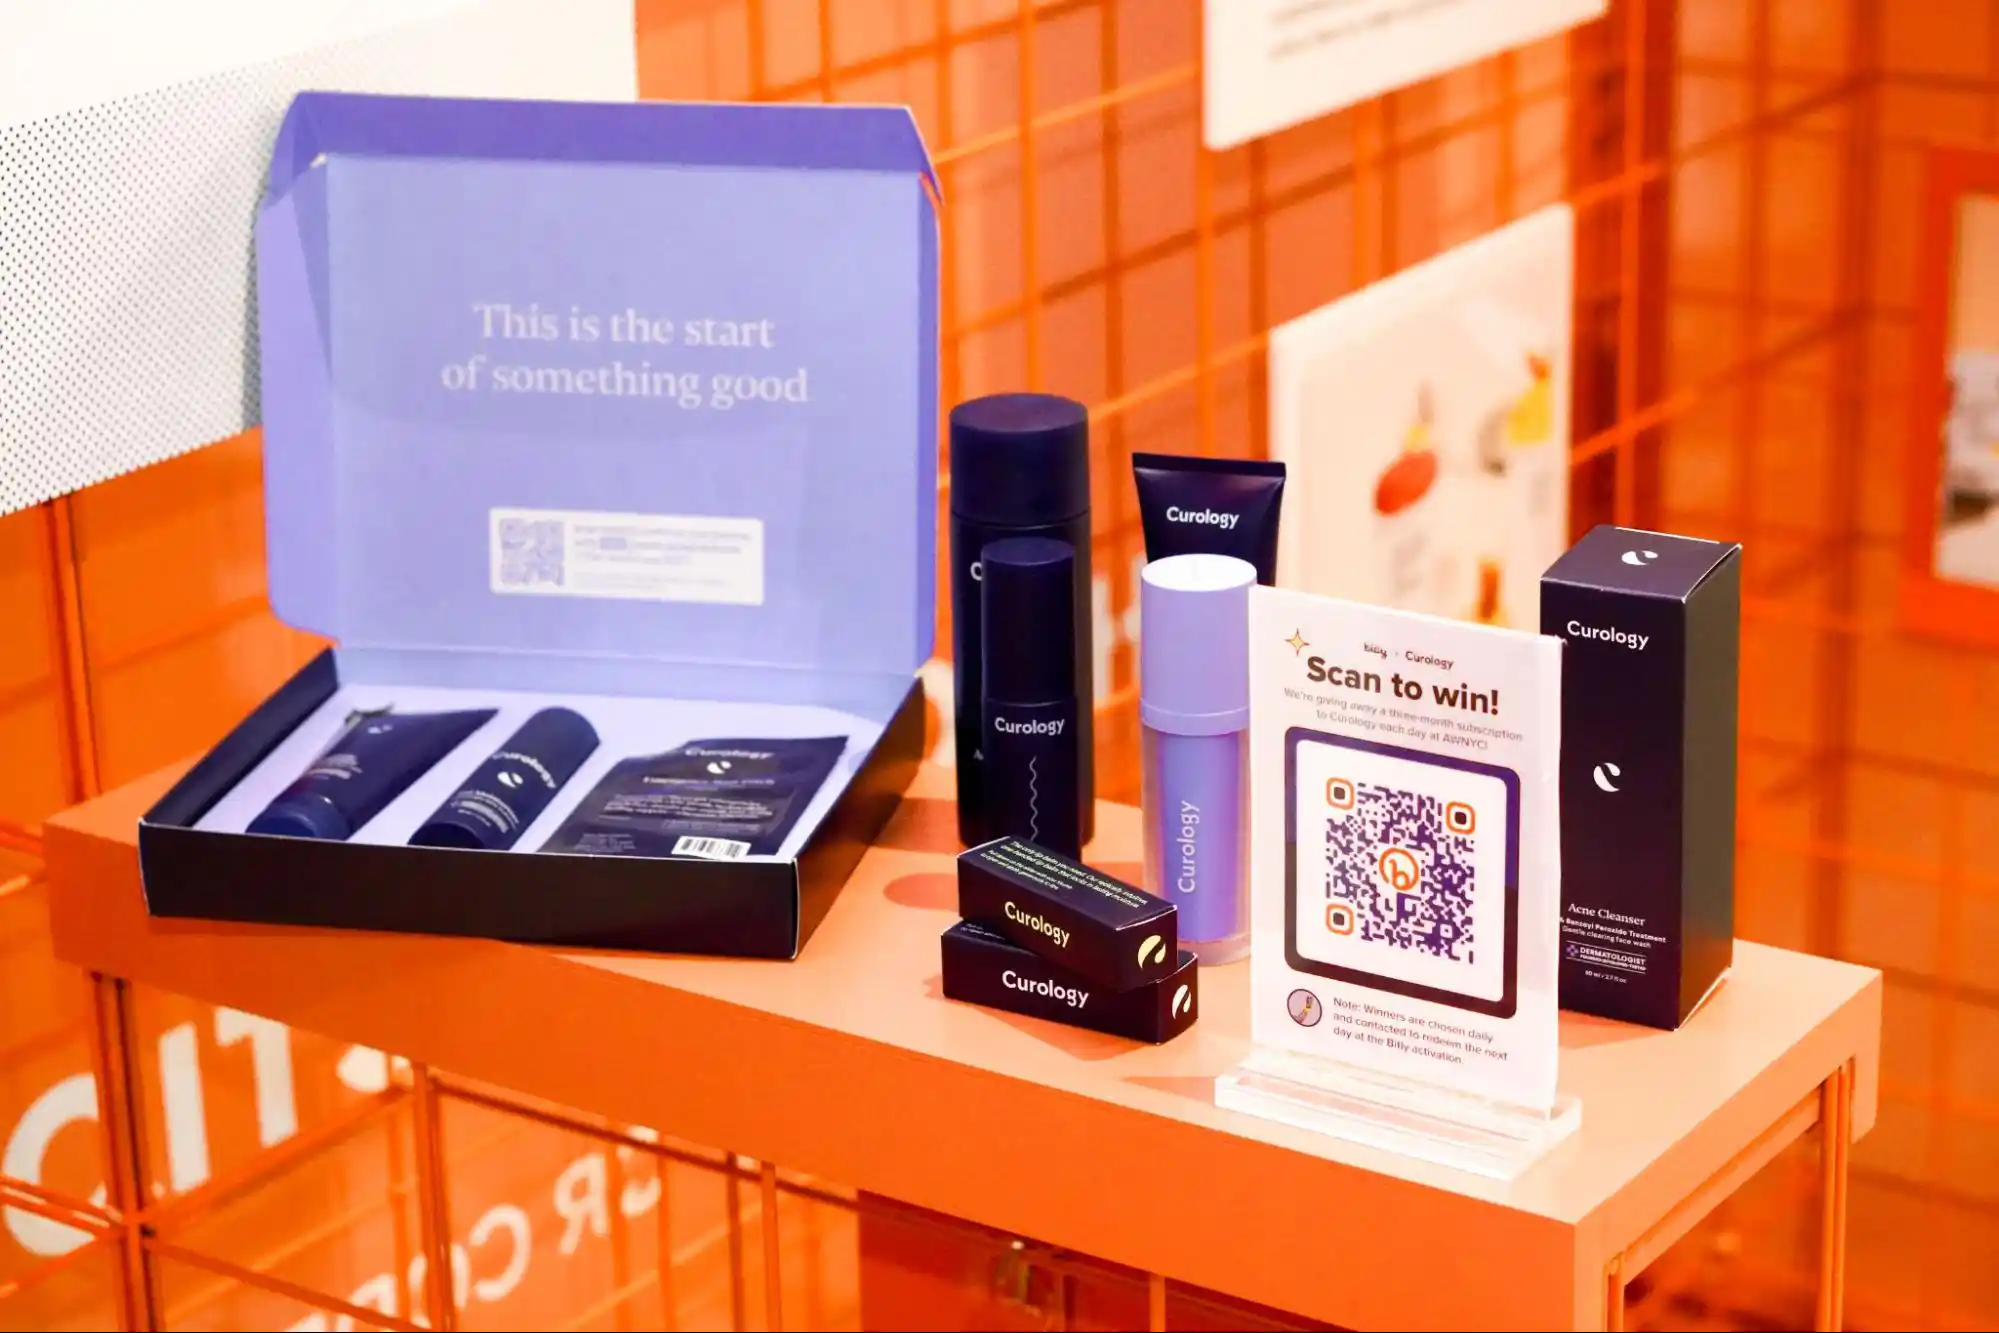
2. Bitly: Activating live events from your exhibit booth
In-person events are the perfect way for brands to build relationships with all-new audiences. Attendees might stop by your exhibit and talk to your team, while others might walk by and simply give your booth a quick glance. QR Codes allow interested attendees to learn more about your brand or share their information with you on the go—all while providing your team with valuable insights and data.
When the Bitly brand team attended Advertising Week New York this year, we saw firsthand how powerful QR Codes are for driving event engagement. From encouraging app downloads to offering AR experiences, some of the biggest brands there were inviting their audiences to engage with them through strategically placed QR Codes throughout the exhibit halls.
Naturally, we used Bitly QR Codes throughout our booth so attendees could scan and learn more. After the event, we looked at each unique QR Code’s performance in Bitly Analytics to gather real-time, actionable data from these in-person interactions. We plan to use these insights to fuel our future event engagement strategies as we aim to boost the number of interactions we have with attendees and tailor our activations based on real data from this event!
HOW BITLY ANALYTICS CAN HELP
QR Codes and Short Links elevate interactivity and help with data collection at events. With Bitly Analytics, you can look at the performance of both individual campaigns (like all the QR Codes you created for one particular event) and your overall scans and clicks across multiple campaigns. See which offline placements are driving the most engagement and use those insights to optimize your next event!
Want more tips on how to use QR Codes to activate your next event? Read more about what we learned about using QR Codes at Advertising Week New York.
3. Daily Harvest: Amping up in-store interactions
It can be tricky to understand how your audience engages with you in stores, especially for consumer packaged goods (CPG) brands that typically distribute through big-box retailers. What do shoppers want to learn more about? What’s compelling about your brand? With QR Codes and Short Links, you can take in-person shopping trips from off-the-record to data-rich and engaging interactions—just like Daily Harvest.

Daily Harvest placed Bitly QR Codes on freezer door clings in hundreds of Kroger locations. The codes invited shoppers to learn more about their farm-fresh products. As an added incentive, the brand donated $5 to sustainable farming for every scan. Not only do customers get to give back, but Daily Harvest also gets intel into where its customers are, which campaigns are performing best, and how they can improve for moving forward.
HOW BITLY ANALYTICS CAN HELP
Understanding in-store engagement doesn’t have to be a mystery! By strategically incorporating QR Code on product packaging and displays, you put offline engagement on the map. Access real-time audience data (like when and where people are scanning) in Bitly Analytics.
4. Rad Power Bikes: Tapping into interactive offline campaigns
North America’s largest electric bike brand, Rad Power Bikes, is on a mission to change how people get around, and they infuse adventure into every interaction with their customers. They enhance in-store engagement by letting customers scan Bitly QR Codes to join waitlists for upcoming products or even schedule a service. But they also used QR codes to drive and measure engagement with their offline marketing campaign to find “America’s Most Bored Person.”

Memorable outdoor ads are hard to ignore—and now, they’re easy to measure, too. Rad Power Bikes incorporated Bitly QR Codes into their campaign, inviting people to scan for instructions on how to enter and learn about the lucky winner’s prizes. They could also see where those scans were coming from and use data from the campaign to strengthen their other advertising efforts going forward.
HOW BITLY ANALYTICS CAN HELP
See how your ongoing marketing efforts are performing over time. Tap into big-picture data to find out how seasonal campaigns—like contests, giveaways, and limited-time offers—boost traffic, engagement, and sales.
Offline doesn’t mean under the radar
If offline marketing channels are a core part of your strategy, measuring engagement from those sources is an essential way to understand your audience, show ROI on those campaigns, and optimize your efforts. When you use QR Codes or Short Links to drive action, you make it easy for your audience to learn more about your offerings and you learn more about your audience’s behavior and preferences with real-time data.
Bitly Analytics gives you a bird’s eye view of the success of your campaigns and helps you track engagement across every channel, all from one central location. Offline marketing channels still pack a punch and go a long way toward building connections with your audience. And the Bitly Connections Platform is here to help, every step of the way.


