Your campaign just hit 10,000 clicks. The dashboard looks great, the team is excited, and then someone asks how many people you actually reached.
That question exposes a gap many marketers run into when reporting campaign performance. Total clicks and unique clicks measure different things, and the relationship between those numbers can completely change the story the data tells.
The framework itself is simple: total clicks show activity, while unique clicks estimate reach. The real challenge is understanding what those metrics signal across different channels.
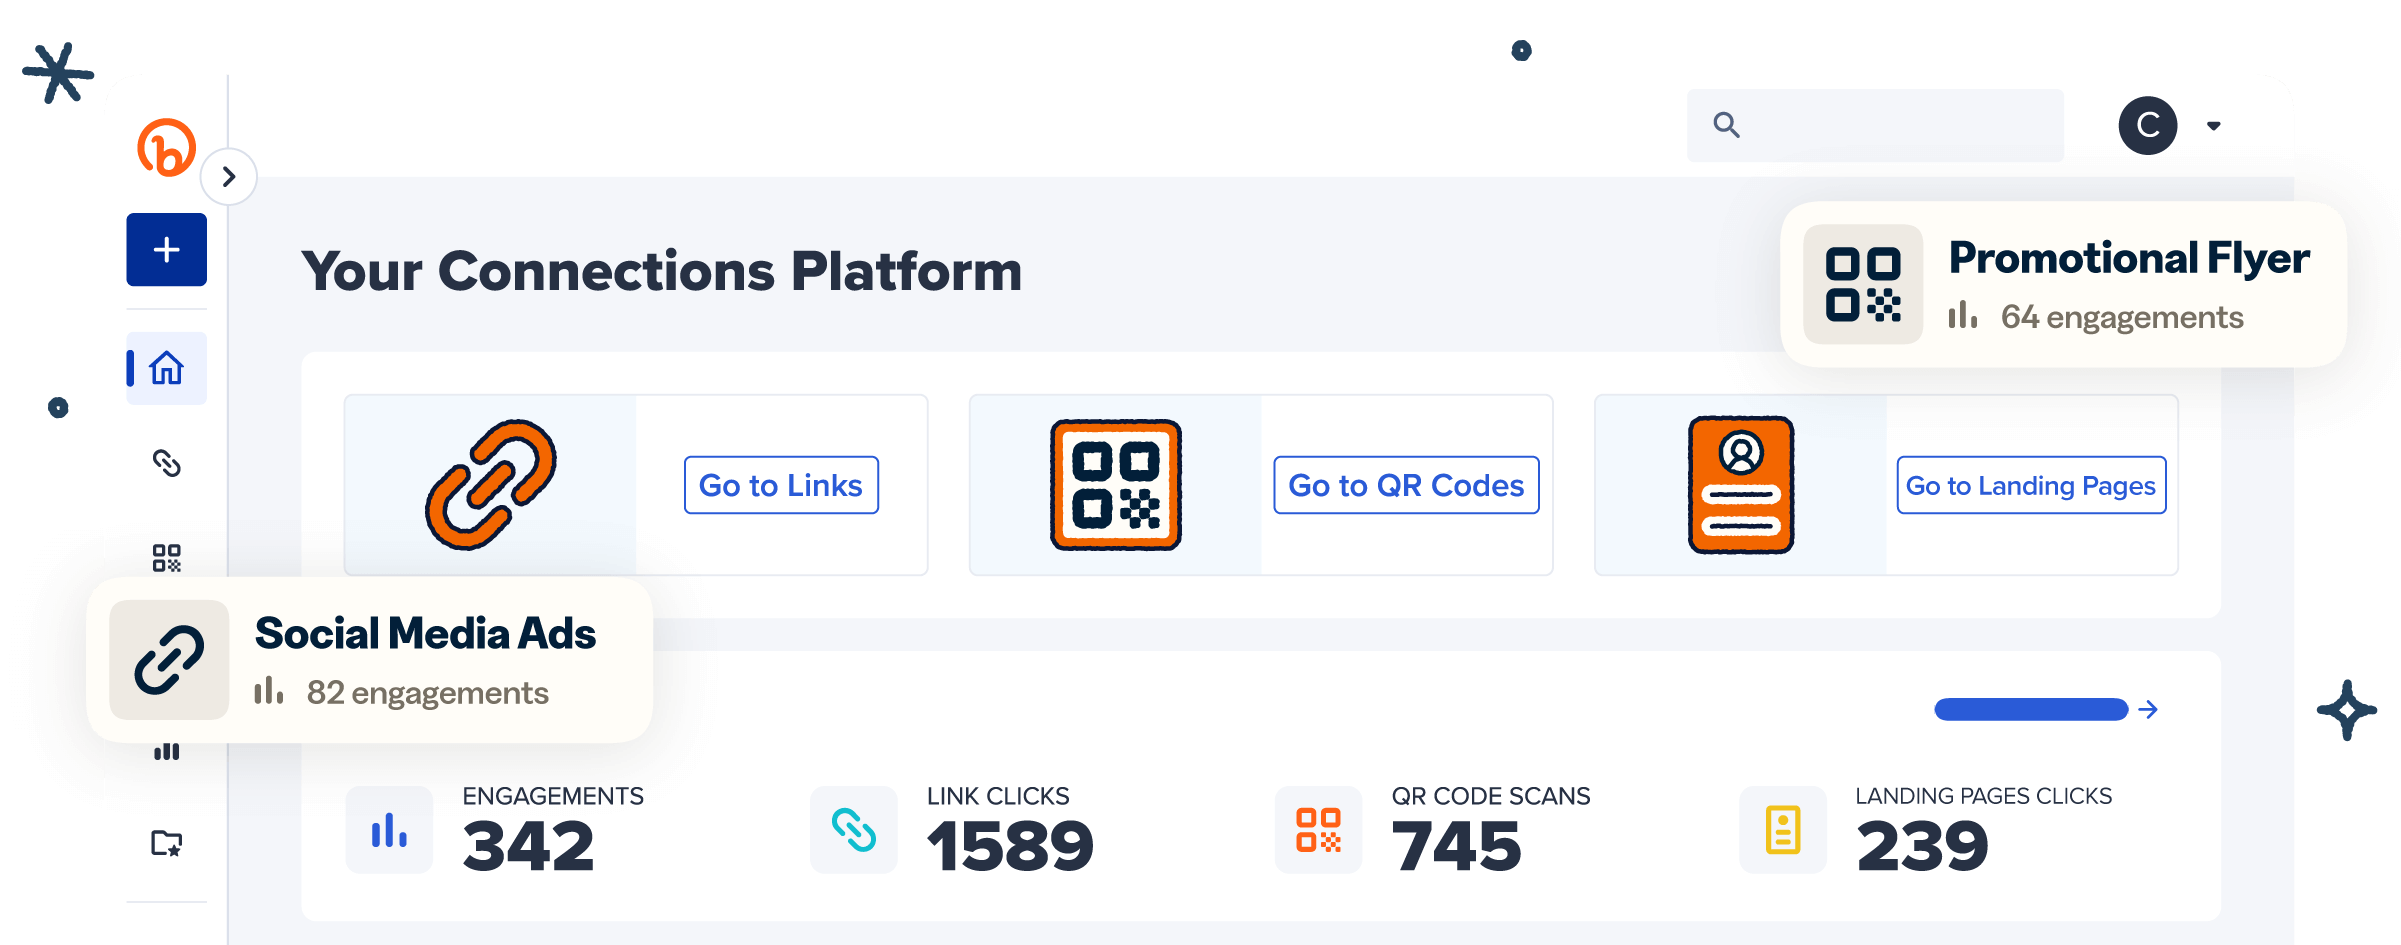
Bitly Analytics shows both metrics side by side, making it easier to compare reach and repeat activity without building a spreadsheet from scratch. In this post, we’ll break down what each metric actually measures, how to evaluate the ratio by channel, and what actions the data should trigger next.
Note: The brands and examples discussed below were found during our online research for this article.
Key takeaways
- Total clicks show activity volume, while unique clicks help you estimate how many distinct people engaged with your campaign.
- A high total-to-unique click ratio may signal strong repeat interest in email, but it can also flag invalid traffic in paid campaigns.
- In link analytics, unique clicks usually reflect deduplicated devices or browsers rather than verified individuals, so they should be treated as a reach proxy.
- For QR Codes and offline placements, unique scans can provide a clearer picture of how many people your signage, packaging, or direct mail piece may have reached.
- When Bitly shows unique and total clicks side by side, teams can quickly identify whether a campaign should be celebrated, investigated, retested, or scaled.
The question every CMO eventually asks
At some point, a stakeholder will look past the click total and ask how many actual people saw your campaign.
It’s a fair question because large click numbers can create a misleading picture of campaign reach. A report showing strong activity may still reflect a relatively small audience if the same users are clicking repeatedly across the campaign lifecycle.
That distinction matters more than many teams realize. Overestimating reach can distort channel decisions, misallocate budget, and erode stakeholder confidence. When activity and reach get treated as the same thing, attribution becomes harder to trust, and optimization decisions become less precise.
Total clicks vs. unique clicks: What each number actually counts
When comparing total clicks vs. unique clicks, accuracy isn’t really the issue. The two metrics answer different questions.
Total clicks count every recorded click event, including repeat activity from the same source. Unique clicks count distinct clickers within a reporting window.
For example, if one subscriber returns to the same email offer five separate times, that activity counts as five total clicks but only one unique click.
Unique clicks can never exceed total clicks, and the two numbers only match when every recorded click comes from a different user, which rarely happens in practice.
Total clicks measure activity volume
Total clicks capture every click event on a link, including repeated visits from the same person. That volume can reflect strong interest, urgency, or friction depending on the context.
For example, a subscriber clicking your email link three times might be genuinely interested in the offer, struggling with a broken landing page, or triggering clicks from an email security scanner.
The click total alone can’t tell you which explanation is correct. That’s why repeated activity should be evaluated alongside channel context, landing page behavior, and other campaign signals.
Unique clicks measure distinct reach
Unique clicks deduplicate clickers within a reporting window, collapsing repeat activity from the same source into a single count. In practice, that means someone clicking your link more than once across several days will usually still count as one unique click.
That gets you closer to campaign reach because it filters out repeat behavior and separates returning visitors from new ones. Instead of relying on raw activity volume alone, you get a clearer estimate of how many distinct people your campaign reached.
For teams reporting performance internally, that added clarity can make audience growth and campaign reach easier to evaluate with confidence.
What «unique» means in analytics
In most platforms, «unique» refers to a deduplicated device or browser identity, not a verified human being. The same person clicking from a phone and a laptop may count as two unique clicks, while repeated clicks from the same browser often count as one.
Privacy-focused browsers and tracking limitations can complicate the picture further by splitting visits across sessions or days. Unique clicks are a useful proxy for reach, but they’re still an estimate rather than a precise headcount.
How to read the total-to-unique ratio by channel
Once you have both numbers, the next step is comparing them.
Divide total clicks by unique clicks, and you get a ratio that shows how much repeat activity each unique clicker generated. A ratio of 3.0, for example, means each unique clicker averaged three clicks.
On its own, that number means very little. The same ratio can signal healthy re-engagement in one channel and suspicious traffic in another.
That’s why channel context matters when evaluating the total-to-unique ratio.
Email: A high ratio can signal genuine re-engagement
In email, a high total-to-unique ratio often means subscribers are returning to the same link repeatedly.
That can reflect strong interest in a time-sensitive offer or a resource worth revisiting. However, it may also result from email security tools that automatically scan links before a recipient ever clicks, inflating totals without human involvement.
Review open-to-click patterns and landing page behavior to help distinguish genuine engagement from automated activity.
Paid social and display: A high ratio is a red flag worth investigating
In paid campaigns, the same inflated ratio deserves more skepticism.
Meta separates Clicks (All) from Link Clicks, which helps explain why raw click totals can appear inflated before you isolate meaningful engagement.
Before celebrating a large click volume, investigate bots, accidental taps, broken placements, and fraudulent activity. In paid media, high activity without proportional reach growth can be a warning sign rather than a performance win.
That risk becomes harder to ignore as spam traffic and automated ad fraud continue affecting paid campaigns. Compared to channels like email, paid placements are exposed to non-human traffic and accidental interactions that can inflate click totals without reflecting genuine audience interest.
QR Codes: Unique scans as a proxy for real-world reach
This is where the framework extends beyond digital channels, and it’s why QR Code tracking is so valuable.
When someone scans a QR Code on packaging, signage, or a direct mail piece, unique scans approximate how many distinct people engaged with that placement in the real world. That makes unique scans one of the clearest indicators of offline campaign reach available to marketers.
Link analytics across campaigns: Depth vs. breadth of audience
When comparing channels, the ratio between total and unique clicks helps you distinguish broad reach from repeat engagement.
A campaign with fewer unique clicks may still outperform one with higher click volume if returning visitors reflect stronger consideration from qualified prospects.
The key is segmenting by campaign, asset, and audience so you’re comparing like with like. For teams managing links across multiple channels, omnichannel link tracking helps bring those comparisons into one reporting structure.
Why unique clicks matter for customer acquisition cost accuracy
If you use total clicks as a reach proxy in your customer acquisition cost (CAC) calculation, the math gets distorted.
Say you spend USD 5,000 on a campaign that generates 10,000 total clicks and 50 conversions. Your cost per click looks like USD 0.50. But if unique clicks are only 3,000, your actual cost per unique visitor jumps to USD 1.67, changing how the campaign’s efficiency gets evaluated.
More accurate reach data supports better budget allocation and stronger executive reporting. When branded link analytics feed consistent, deduplicated data into your attribution model, you can evaluate acquisition costs with greater confidence instead of relying on inflated activity totals.
What action each ratio should trigger
Not every ratio calls for the same response. Use the pattern and channel context together to decide your next move.
For example, a low ratio (close to 1.0) across channels usually signals broad reach with relatively little repeat activity. That may be a positive outcome for awareness initiatives, but it may also indicate weaker engagement than expected.
Meanwhile, a high ratio in email may warrant scaling the campaign or extending the offer window. A high ratio in paid social or display should trigger a closer review of referral sources, geography, device mix, and landing page behavior before drawing conclusions.
The goal is to turn the ratio into a decision-making tool rather than a vanity metric. Once you understand what the pattern reflects, it becomes easier to identify what deserves more budget, further testing, or closer investigation.
How Bitly surfaces both metrics without the manual math
Bitly Analytics shows total clicks and unique clicks by default, turning the comparison into a habit rather than a spreadsheet project. Because Bitly Links and Bitly Codes work across email, social, paid, packaging, and events, you can compare clicks and scans across channels in one view.
For teams that need short link tracking analytics in real time, along with deeper exports, custom domains, Single Sign-On (SSO), team management, or API access, it’s worth exploring which Bitly plan fits your measurement needs.
Stop guessing at reach and start measuring it with confidence
Reach answers who you touched. Total clicks reveal how intensely people engage. Neither metric tells the full story on its own, but together they provide a clearer view of campaign performance. The ratio between total clicks and unique clicks can help teams separate genuine interest from inflated activity, evaluate reach more accurately, and make reporting decisions with greater clarity.
Bitly Analytics surfaces both metrics side by side, making it easier to compare reach and repeat activity without relying on manual spreadsheets or disconnected reporting tools. With Bitly Links and Bitly Codes, teams can monitor engagement patterns more consistently as campaigns move between digital and offline touchpoints.
Explore Bitly pricing plans to find the right fit for your reporting, tracking, and measurement needs.
FAQs
What is the difference between unique clicks and total clicks?
Total clicks count every click event on a link, even when the same person clicks more than once. Unique clicks count distinct devices or browsers that clicked at least once, so they measure reach more closely than activity volume. Looking at both helps prevent a large click total from overstating how many people your campaign actually reached.
What does unique mean in link analytics?
In most platforms, unique doesn’t mean a verified person; it refers to a deduplicated device or browser identity within a reporting window. That matters because one person clicking from multiple devices may appear as multiple uniques, while repeat clicks on one device usually collapse into one. It’s useful, but still an estimate rather than a precise headcount.
Why does the total-to-unique click ratio matter?
The ratio shows how much repeat activity each unique clicker generated, helping teams separate broad reach from repeated engagement. In email, a higher ratio may signal repeat interest, while in paid campaigns, the same pattern may warrant a fraud check. That comparison turns two simple metrics into a fast diagnostic tool for evaluating campaign performance more accurately.
How should I interpret unique clicks across email, paid ads, and QR Codes?
For email, unique clicks usually show audience response, while total clicks can reveal whether subscribers kept returning to the same offer. For paid ads, an unusually high gap may point to bots, accidental clicks, or low-quality traffic that deserves a closer look. For QR Codes, unique scans are often your clearest proxy for how many distinct people interacted with a placement in the real world.
How does Bitly help teams compare unique clicks and total clicks?
Bitly Analytics shows unique clicks and total clicks side by side, so your team can compare reach and activity without manual math. That default view can help surface inflated reporting faster across links, QR Codes, and campaigns. If you need that level of measurement in one dashboard, a paid Bitly plan is worth exploring.