
Marketing doesn’t happen in one place anymore. Someone might scan a QR Code on a poster, tap a link in an SMS, or click from your newsletter before landing on your site. With that many touchpoints in play, it’s easy to lose sight of what’s actually driving engagement.
Clicks and scans are early signals. They show which messages earn attention, which channels pull people in, and where interest fades. When you can see that activity in one place, you can optimize campaigns while they’re still live—not weeks later in a post-mortem.
Bitly Analytics brings those insights together, tracking engagement across Bitly Links, Bitly Codes, and Bitly Pages. In this guide, you’ll learn how to measure clicks and scans over time, understand where traffic comes from, and use those insights to improve reporting and campaign decisions.
Note: The brands and examples discussed below were found during our online research for this article.
Key takeaways:
- Bitly Analytics measures engagement at the connection layer, showing how people interact with links and QR Codes across channels before they ever reach your site.
- Click and scan data reveal where attention starts, helping teams see which campaigns, messages, and placements are gaining traction.
- When paired with web analytics and CRMs, Bitly adds upstream context, making reporting clearer and optimization decisions more grounded.
- Consistent use of Bitly Links and Bitly Codes strengthens link management, creating cleaner data and more reliable insights over time.
What Bitly Analytics is (and what it isn’t)
Bitly Analytics gives you a clear view of how people engage with the links, QR Codes, and landing pages you create in Bitly. You can see how often they’re clicked, scanned, or viewed, along with where that activity originates, so you can understand interest as it happens without switching between tools.
It doesn’t track what happens after someone reaches your site. You won’t see conversions, purchases, or revenue metrics here. That’s intentional, and it’s what keeps the data clean.
By focusing on the moment of the click or scan, Bitly Analytics helps teams evaluate performance early and adjust messaging or distribution more effectively. Keeping a clear boundary between click data, scan data, and downstream outcomes makes reporting simpler and easier to act on.
The connection layer view of performance
Every campaign has a handoff moment. Someone sees your message, then decides whether to click a link or scan a QR Code to keep going. That split second, when they move from one channel to another, is the connection layer—where attention turns into measurable action.
Offline ads, emails, social media posts, packaging, and events all play a role, but none tell the full story alone. Looking at engagement at that moment makes it easier to compare which channels are actually driving interest.
Bitly Analytics makes that moment visible. By measuring the connection layer, teams can see what captures interest, invest more in high-performing channels, and address weak spots early.
Where Bitly Analytics fits in a measurement stack
Most teams rely on tools like Google Analytics (often paired with UTM parameters) or customer relationship management (CRM) systems to understand what happens after someone lands on a page. That’s valuable data, but it doesn’t explain how they got there.
Bitly Analytics adds that missing context. If a page underperforms, Bitly’s landing page analytics can show whether visitors arrived from a QR Code at an event or an email link. That upstream view helps teams interpret downstream results more accurately and resolve issues faster.
Remember: Bitly doesn’t replace your existing tools. It connects with CRM and other systems, working alongside them to give your measurement stack the clarity it needs.
Clear limitations to communicate
Bitly Analytics shows what happens at the moment someone clicks or scans. It doesn’t track what happens afterward, such as conversions, form submissions, or purchases, and it doesn’t identify individual users. That data lives in your other tools.
Being clear about these boundaries keeps everyone aligned. A dip in clicks doesn’t automatically mean a campaign failed. It simply means fewer people took that first step.
When those limits are understood, teams can focus on what’s actionable, such as testing messaging, adjusting placement, or refining distribution, without overstating the impact or misreading the numbers.
What you can measure with Bitly Analytics
Bitly Analytics surfaces the core engagement signals behind your campaigns. You can break down activity by timing, source, and location. Each of these dimensions adds context. Together, they help you spot trends, compare performance, and make informed decisions while campaigns are still running. Below, we break down what each view shows and how teams use it.
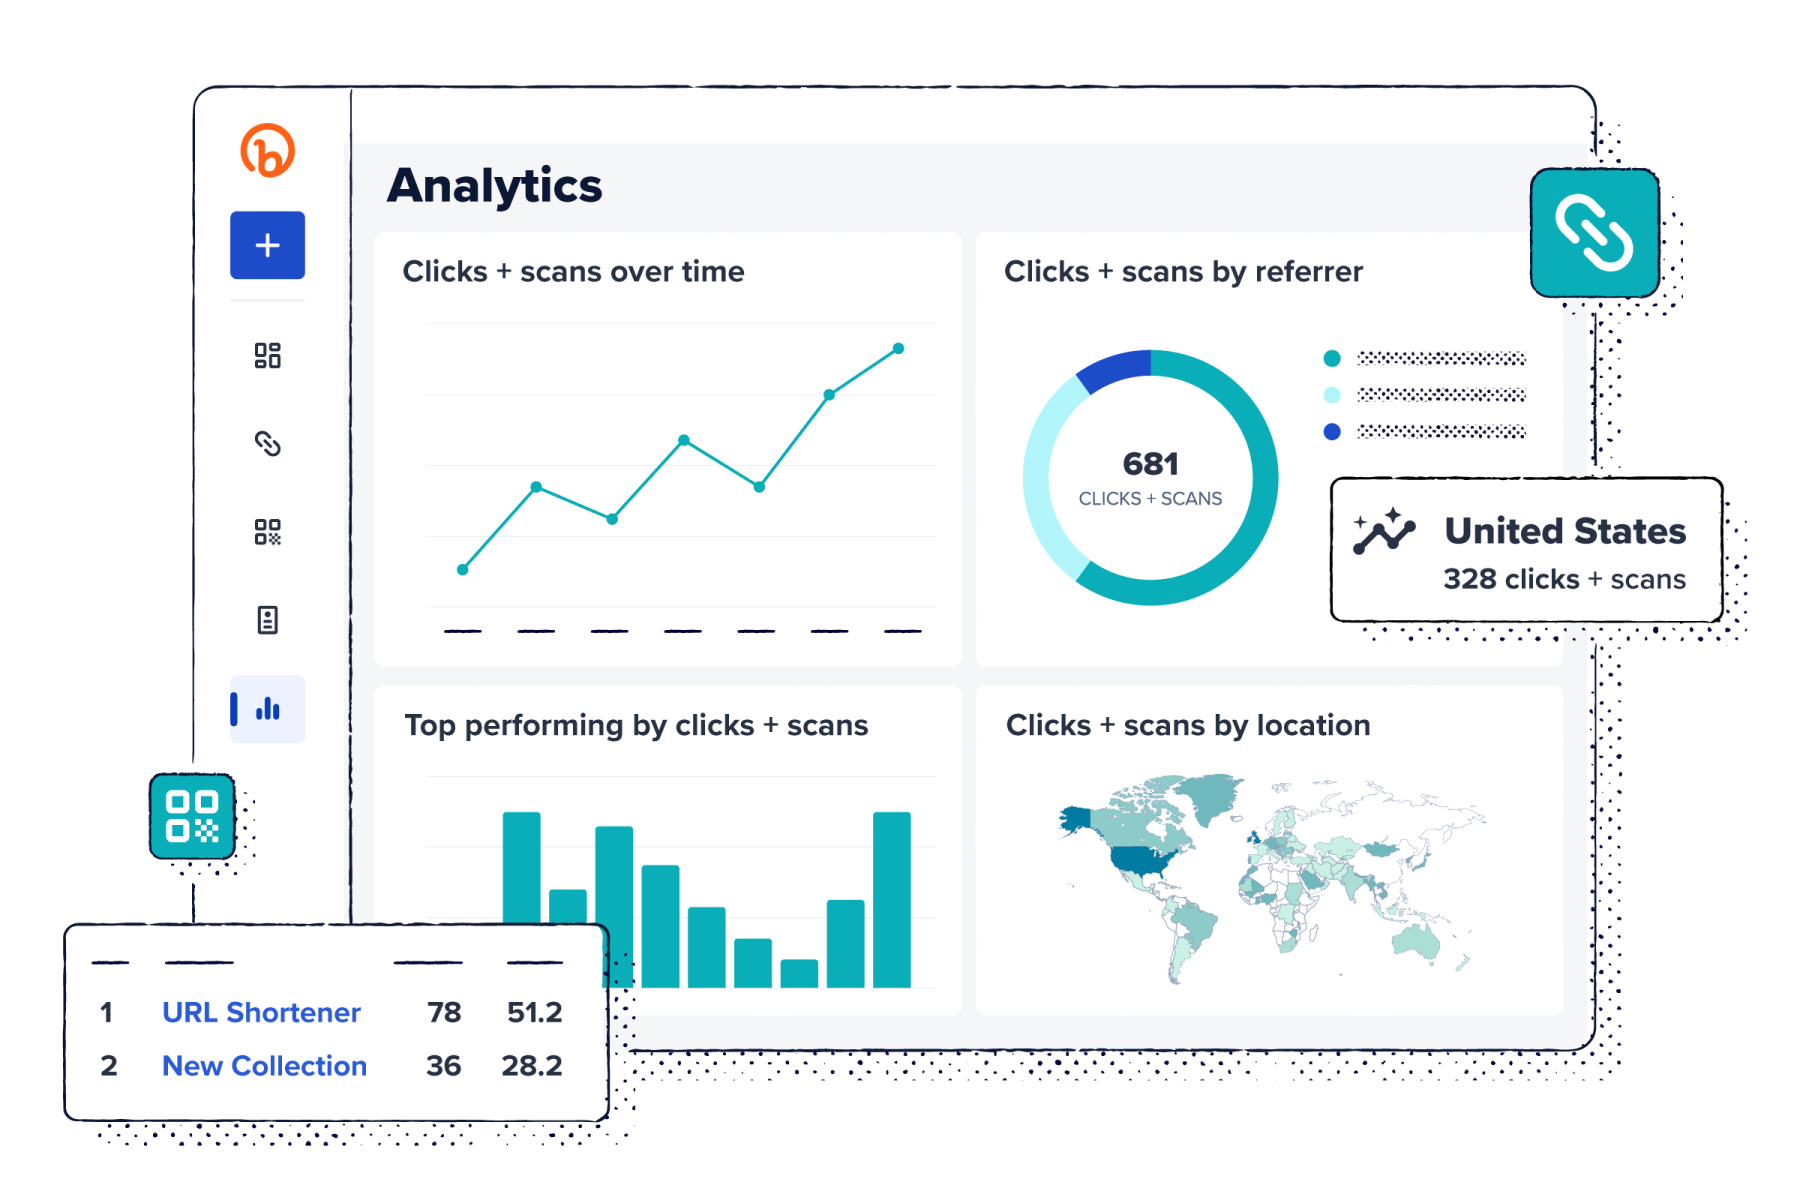
Engagement volume over time
Tracking clicks and scans across campaigns and timeframes reveals the rhythm of your campaign, not just the totals. You can see momentum build after an announcement or spot spikes when a link gains traction.
Patterns in that activity help teams make smarter decisions about timing and pacing. You might notice that email links perform best midweek, or that a QR Code on event signage peaks during specific hours. Those insights help you plan launches, promotions, and follow-ups around real audience behavior.
Referrers and channel context
Seeing which links and QR Codes generate traffic from email, social posts, or printed materials clarifies which channels drive interest. Bitly Analytics surfaces referrer data in real time, making it easy to compare channels and campaigns at a glance.
With that visibility, teams can shift effort where it has the most impact. If a QR Code on a flyer drives more clicks than a social post, that may signal a stronger offline response or a need to adjust messaging for underperforming channels.
Location and geographic patterns
Geographic trends show where campaigns are generating activity. A QR Code displayed at a Chicago trade show may generate 80% of its scans within the surrounding metro area, while email links see higher click concentration in California and Texas, where previous campaigns have driven strong engagement.
Location data is aggregated and not tied to individual users. These patterns help teams reallocate budget to high-performing markets, expand event presence in cities showing high scan activity, or test localized messaging in regions where response is lower than expected.
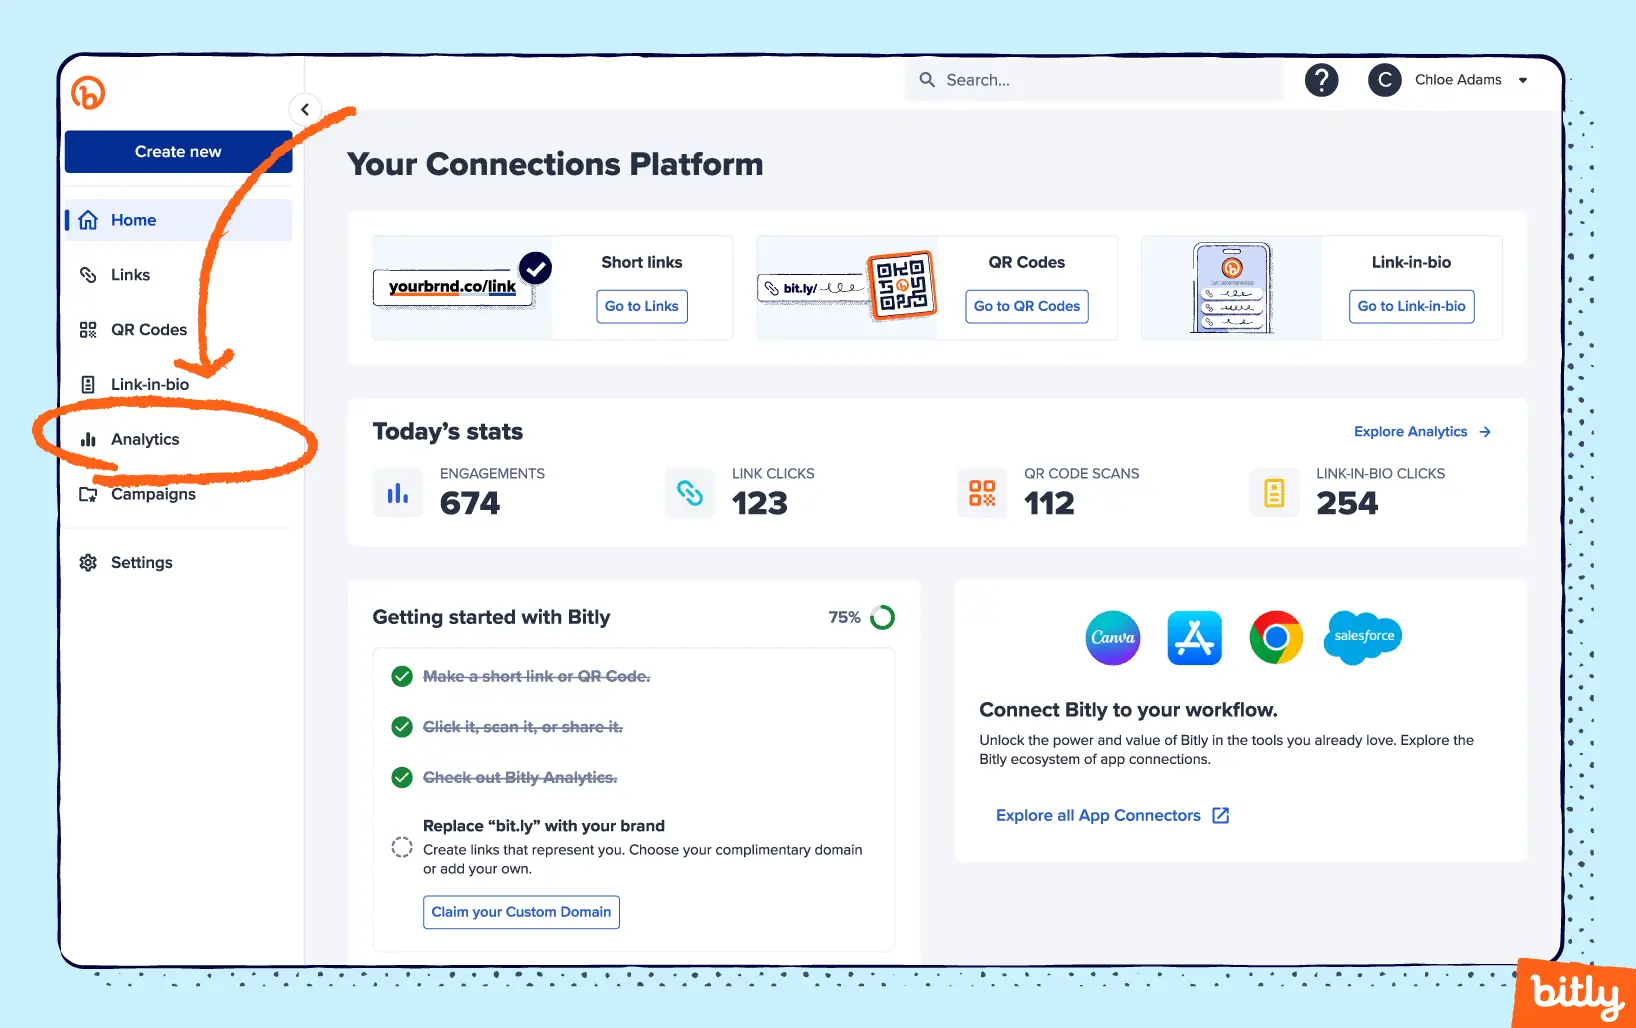
Bitly Analytics dashboards and reporting views
Bitly dashboards provide a clear snapshot of overall performance, with the ability to drill into the details that matter most. You can see which links and QR Codes generate the most activity and how landing pages are performing. Below, we outline the different dashboards available and how teams use them to identify top-performing assets and improve campaigns.
Links and QR Codes dashboards
This dashboard gives you a consolidated view of Bitly Link and Bitly Code performance. You can track link clicks and scans over time, see where traffic originates, review geographic activity, and analyze device breakdowns. Filters allow you to narrow the view to specific campaigns or high-performing assets.
Teams use this dashboard to quickly assess strengths and gaps across channels. A Facebook post may generate steady clicks while a QR Code at an event sees limited scans, or activity may spike immediately after an email send.
Landing page dashboards
The landing page dashboard shows how people engage with your Bitly Pages. You can track views over time, see which buttons or links receive the most clicks, and uncover patterns such as which sections attract attention first or which calls to action (CTAs) drive the most interaction.
This view supports clearer conversations about page performance. If a primary button consistently outperforms a secondary link, that insight can inform messaging or layout adjustments.
Filtering and comparison
Filters in Bitly Analytics let you zero in on a specific timeframe, campaign, or group of assets without extra noise. That way, you can see which QR Codes drive the most clicks or which placements show lower engagement.
Comparison views let you review campaigns or assets side by side, so differences become clearer across timing, channel, or placement. One QR Code may draw more scans than another, or a paid search ad may attract more clicks than a social post.
How Bitly Analytics supports campaign analytics
Bitly Analytics works best when it’s built into your campaign plan from the start. Strong link management keeps reporting structured and easier to interpret across channels. That structure makes mid-campaign reviews and post-campaign analysis more efficient. Below, we outline how to integrate Bitly Analytics into practical campaign workflows.
Step 1: Define campaign goals
Before creating Bitly Links or Codes, clarify what success looks like for your campaign. In Bitly Analytics, that typically means defining expectations around clicks and scans, including volume and timeframe.
A product launch might focus on sustained activity over several weeks, while an event promotion may prioritize a short spike immediately after an email send or flyer distribution. Setting those expectations early gives your data context and makes it easier to determine whether a campaign is gaining traction or needs adjustment.
Step 2: Standardize links and QR Codes
Giving your links and QR Codes clear, standardized names prevents reporting confusion once a campaign wraps and everyone’s trying to remember what went where.
A shared naming structure makes comparisons straightforward. It becomes easier to evaluate how an email link performs relative to a social post, or whether a QR Code on a flyer drives more scans than one on packaging.
Step 3: Monitor early signals
A link in a text message may attract more traffic than expected, while a section of your Bitly Page that seemed promising receives limited taps. Spotting these shifts early allows you to adjust messaging, placements, or budget while the campaign is still active.
Even small changes in activity can be meaningful. If one CTA sees a stronger response than others, you can amplify it or refine weaker elements. Acting on early signals keeps campaigns flexible, so you’re not waiting until the end to evaluate performance.
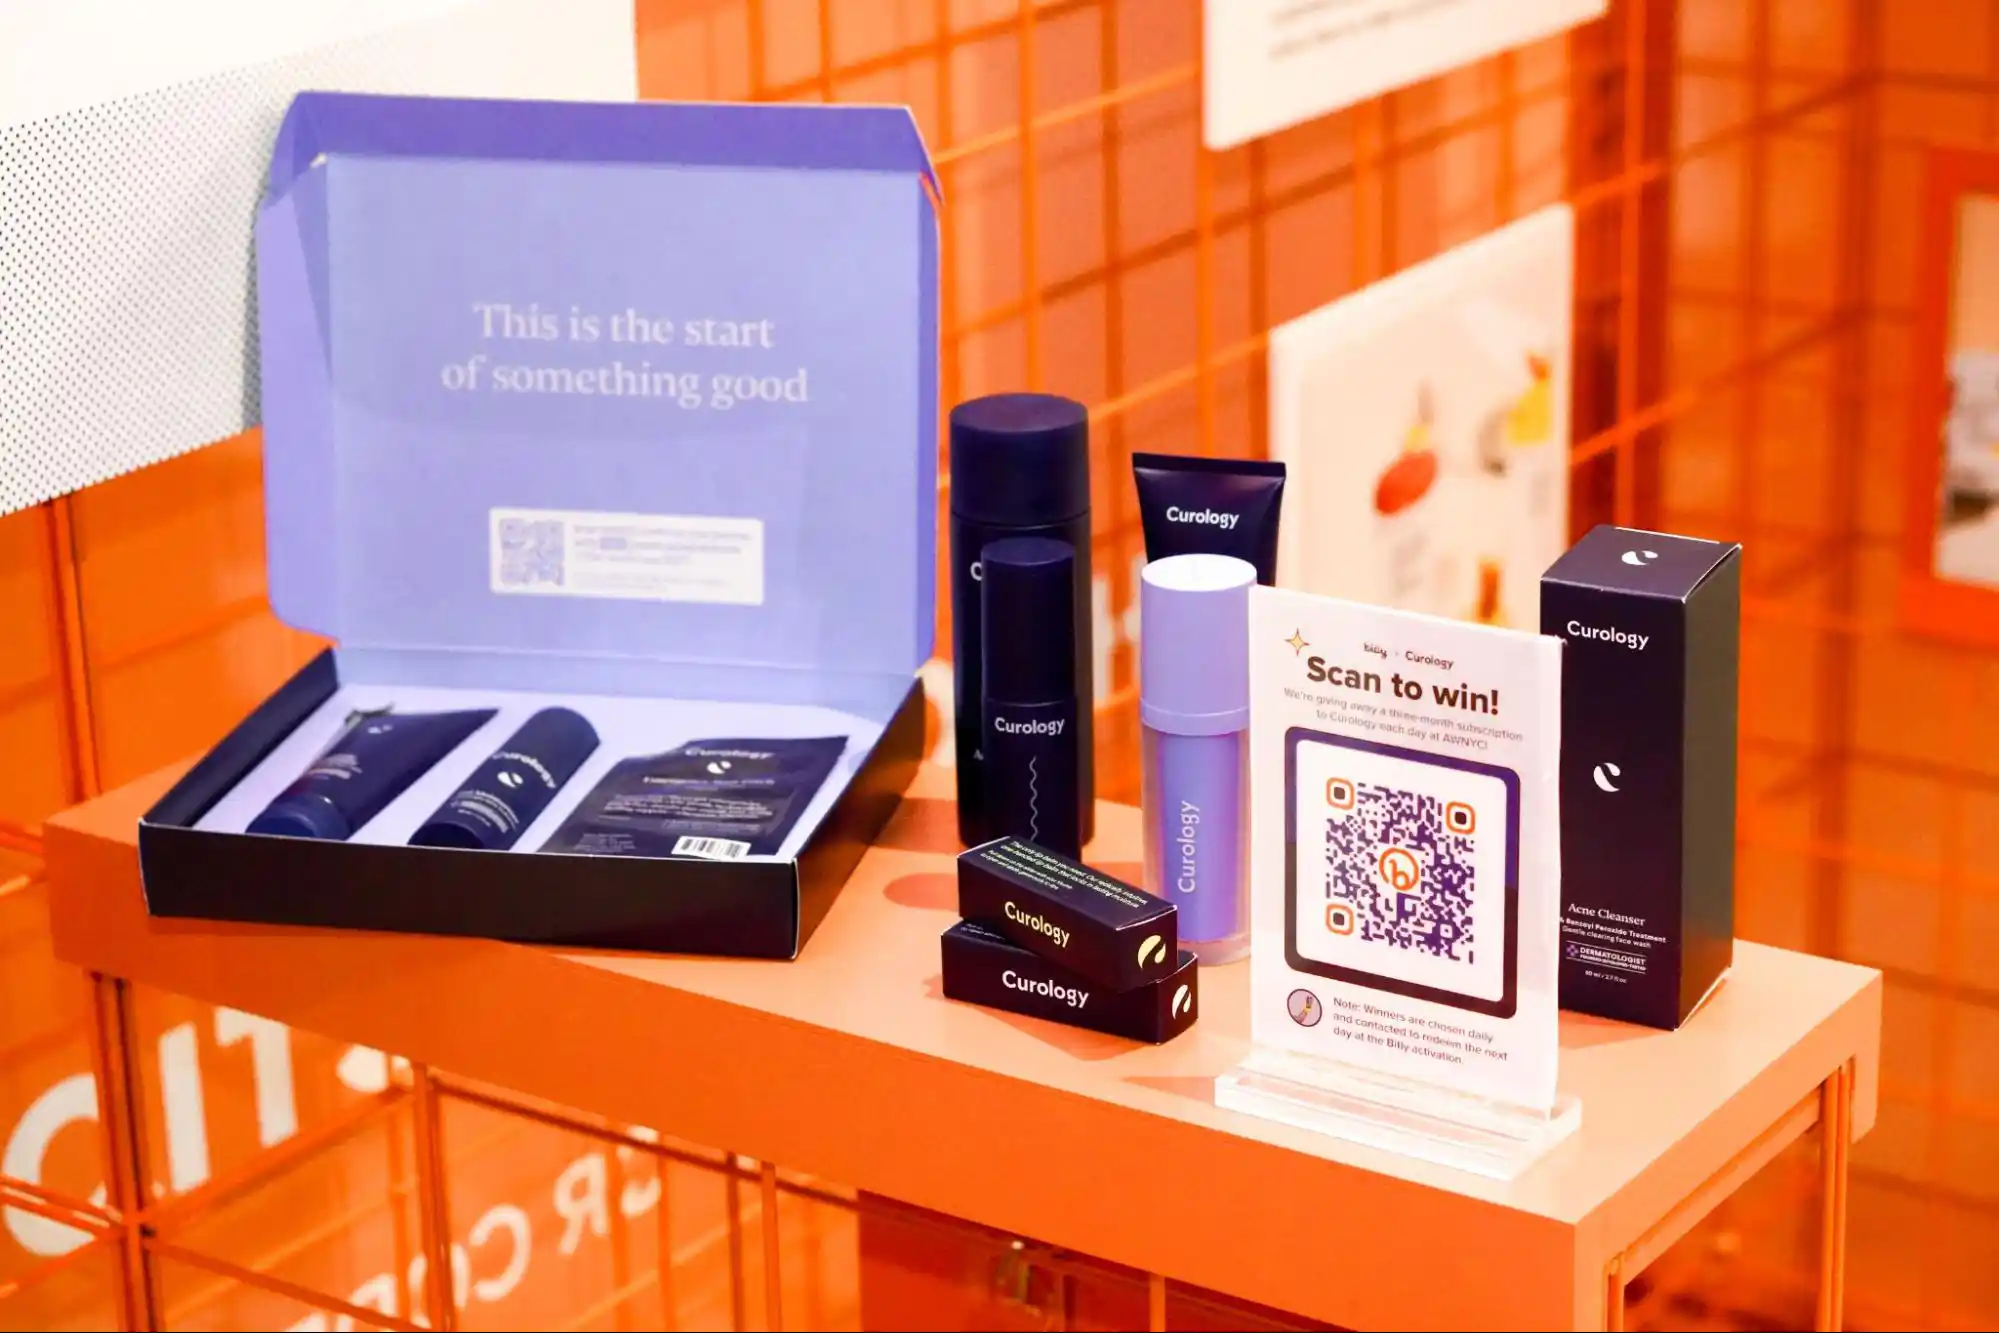
Measuring offline marketing with Bitly Analytics
Offline campaigns can feel like a guessing game. You put up a poster or hand out a flyer, but without tracking, it’s hard to know if anyone acted on it.
QR Codes and short links give those physical touchpoints a measurable path into your analytics. With Bitly Analytics, you can track scans and clicks from offline placements and evaluate them with the same structure you use for digital campaigns.
Why offline measurement is hard without tracking
Offline channels are tough to measure because you can’t see clicks the way you do online. Posters, flyers, event booths, and packaging leave little trace unless there’s a trackable link attached. Without one, you’re left guessing which placements actually worked and which just looked good on paper.
That uncertainty makes it harder to decide where to invest next. Without measurement, campaigns rely on assumptions rather than evidence.
What to track for offline campaigns
The key signals for offline campaigns are clicks and QR Code scans, which show who’s taking that first step from a physical asset into a digital experience. Timing and volume highlight when interest rises, while location data indicates which placements receive the most activity.
Scan trends can surface practical insights. If one poster in a coffee shop receives significantly more scans than another in a similar setting, that difference points to creative, placement, or audience factors worth examining. Tracking QR Codes gives you a clearer direction on where to allocate resources and which messages to emphasize.
Offline examples you can model
Here are a few common offline scenarios where Bitly Analytics turns physical campaigns into actionable insight:
- Event booths: Track which session or booth signage attracts the most scans so you can replicate its design or placement in future events.
- Printed materials: Compare flyers, postcards, or posters across neighborhoods to guide distribution decisions.
- Retail or in-store displays: Evaluate which product placements or CTA signs receive the most clicks. Lower activity can signal a need to adjust creative, messaging, or positioning.
The data goes beyond reporting. It gives you practical feedback you can apply immediately, helping each campaign iteration improve on the last.

Proving marketing ROI with Bitly Analytics
Return on investment (ROI) conversations depend on clear, defensible data. Bitly Analytics helps you show how Bitly Links, Codes, and Pages contribute to campaign momentum, making it easier to communicate performance with your team or stakeholders.
Start with the big picture
Before diving into individual links or QR Codes, step back and review overall activity across your campaign or program. Look at how clicks and scans change over time and whether certain channels consistently see higher engagement than others.
This broader view helps frame the conversation around direction and scale, rather than isolated metrics. It provides a clear starting point for executives or stakeholder discussions, grounded in numbers everyone can understand.
Use exports and visuals
Numbers are easier to interpret when they’re presented visually. Exporting Bitly dashboards and adding charts to a deck or shared document makes campaign updates quicker to review, especially for teammates catching up asynchronously.
Consistency matters, too. When stakeholders know where to find clicks and scans from one report to the next, they spend less time navigating slides and more time understanding what the results mean.
Pair Bitly with conversion data
Clicks and scans indicate interest, while conversions and revenue reflect outcomes. When you align Bitly Analytics engagement data with metrics from your CRM, ecommerce platform, or external analytics tool, you get a clearer picture of how attention relates to downstream action.
Bitly engagement data can enhance your existing analytics dashboards by adding visibility into how visitors arrive—not just what they do afterward.
A campaign may produce high click volume but modest sales, or fewer clicks may correspond with higher-quality conversions. Looking at both perspectives together creates a more balanced view of performance, so success isn’t measured by traffic alone.
Turning Bitly Analytics insights into strategic decisions
At some point, the question shifts from “How did it perform?” to “What should we change?” That’s where Bitly Analytics becomes more than a report. It helps you decide whether to reallocate budget, adjust timing, or lean further into a channel that keeps drawing attention. Used consistently, it becomes part of your team’s decision rhythm.
Decide where to double down
When certain links or QR Codes continue to see elevated activity, that’s usually your cue to lean in, whether that means allocating more budget or expanding placements in that channel.
Confidence builds over time. If the same format shows positive results across multiple campaigns or time periods, it’s likely more than a one-off spike. Noticing that repeat performance helps you invest with intention instead of reacting to a single moment of success.
Identify underperforming touchpoints
Low clicks or scan volume usually point to something worth examining, not something to panic over. A QR Code that sees limited activity may be buried in the layout. A link that struggles on one channel may signal a mismatch in messaging or audience fit.
Instead of abandoning the channel entirely, test with small adjustments. Move the placement, simplify the CTA, or tighten the copy. Lower engagement becomes a prompt to improve, not retreat, so decisions stay grounded in observed behavior.
Improve timing and targeting
Engagement often follows a rhythm. Certain times of day, days of the week, or locations can see noticeably higher clicks and scan activity. Paying attention to those shifts helps teams schedule campaigns when responses are more likely.
Testing timing adjustments, like sending an email a few hours earlier or placing a QR Code in a busier spot, allows teams to refine rollout strategies over multiple campaigns. Even modest changes, informed by observed trends, can meaningfully improve outcomes without altering creative or budget.
Make faster decisions
Some trends are hard to ignore when all your engagement data lives in one place. A QR Code on signage may suddenly see a jump in scans, or a social media link may begin gaining more activity than others.
With that centralized insight, teams can pivot quickly—shifting budget, refining creative, or adjusting timing—without waiting for a weekly report. A shared source of data keeps everyone aligned, so decisions move forward instead of stalling.
Setting up Bitly Analytics for clean reporting
Getting your Bitly workspace in order helps streamline reporting every time you open a dashboard. Organized links and QR Codes make it easier to review performance without squinting at numbers. Over time, that structure builds confidence, so when it’s time to make decisions, you’re relying on solid signals rather than guesswork.
Create naming conventions
Naming the links you create with Bitly’s URL shortener may seem tedious, but it makes reviewing dashboards far less frustrating. Including the campaign, channel, or even the month in a link name gives you built-in context when it’s time to filter and compare results.
It doesn’t need to follow a rigid formula. You just need enough consistency so anyone on your team can understand a link’s purpose at a glance.
Document link and QR Code purpose
When multiple people touch the same data, it’s easy to lose track of why a link or QR Code was created, or to reuse it for the wrong campaign. A short description of the audience, goal, or intended channel can prevent confusion or slip-ups later.
Adding context in a shared document or a note in the dashboard helps everyone understand each asset’s role and review performance with clarity.
Build a reporting cadence
Reviewing your dashboards on a set schedule helps you catch subtle shifts before minor issues escalate. A weekly check may show that one channel is seeing more activity than another, or that volume has dipped unexpectedly.
It doesn’t need to be complicated. A short mid-week review, or even a quick daily glance for high-priority campaigns, builds a gut feel for what “normal” looks like, so surprises stand out faster.
Common Bitly Analytics use cases across channels
Clicks and scans happen across social, email, mobile, or printed QR Codes. Your measurement should be just as flexible. Bitly brings those touchpoints into one view, so you can evaluate activity across channels without jumping between tools.
Below, we explore how the same engagement insights show up in everyday campaign workflows.
Email and newsletters
Engagement data can highlight which CTAs and content themes resonate more with your audience. For example:
- A “Read More” CTA may receive more clicks than “Learn More”
- Short, punchy subject lines may result in higher open rates
You can use those insights to refine how you structure emails as well:
- Placing key links near the top may increase scan activity
- Sending on Tuesdays instead of Fridays may lift response rates
Incremental adjustments like these can steadily improve recurring campaigns over time.
Social media
Some posts perform differently depending on where and when you share them. For example:
- Links from Instagram Stories may see more evening clicks, while LinkedIn posts gain more activity mid-morning
- Tweets with trending hashtags may increase scan volume, while similar content on Facebook sees less response
- Quick, concise updates may receive more interaction than longer posts
Those differences make it easier to refine post timing, messaging, and format by platform. This is especially useful for link-in-bio pages, where one link often represents multiple campaigns. Instead of relying solely on native social analytics dashboards, you’re making adjustments based on a broader view of performance.
SMSand mobile campaigns
Short links matter when messages land on small screens. For example:
- A flash sale text with a short link may receive more taps than one with a long, cluttered URL
- Recognizable brand cues can increase trust and click-through
- Messages sent during lunch or early evening may see a stronger response than late-night texts
Small details like these make mobile campaigns easier to track and more effective overall.
Events and experiential marketing
QR Codes turn offline moments into measurable touchpoints. For example:
- A code on a flyer can track resource downloads or event RSVPs
- Signage in high-traffic areas can reveal which placements attract the most scans
- Session-specific codes can highlight which demos or activities draw the most attention
These insights move beyond raw scan counts. They help connect on-site activity to broader event goals, so your team can understand what captured interest and what to refine next time.
Print, packaging, and OOH
Physical touchpoints such as packaging, billboards, transit ads, and printed materials become measurable when paired with the right links or QR Codes. For example:
- A QR Code on a product package can indicate which SKUs lead to more follow-up visits
- Posters placed in different neighborhoods can surface where scan volume is highest
- Printed flyers with varied messaging can highlight which wording results in more clicks
Treating these assets as testable placements gives your team concrete feedback, making it easier to refine design, placement, and messaging over time.

Exporting and sharing Bitly Analytics data
It’s one thing to track links and another to share insights people can act on, both internally and externally. Tailoring the format for each audience makes reporting more consistent and credible.
A quick dashboard snapshot may give leadership an immediate sense of direction, while your team may prefer a detailed table that surfaces changes across campaigns. Clients may value a polished summary that communicates progress without overwhelming them.
Connecting Bitly Analytics to the rest of your measurement story
Bitly doesn’t answer every question, but it clarifies where people are scanning and clicking. Think of it as your first checkpoint, pointing you to where deeper analysis in other tools may be useful, instead of trying to replace them. Here’s how to connect those layers.
Engagement vs. downstream outcomes
Clicks and scans are a positive sign, but they’re not the full story. A rise in engagement means people were interested enough to tap or click, not that they necessarily purchased or subscribed.
Phrases like “increased engagement” or “high click activity” keep reporting accurate, while leaving room for conversion data to provide additional context. Being specific about what Bitly shows, such as click-through rates (CTRs) rather than sales growth, builds trust and keeps your reporting grounded.
Asking better questions of other tools
Bitly can shift how your team talks about performance. If a new landing page is getting steady clicks but conversions look flat elsewhere, that’s your cue to open your analytics platform and see what happens after the visit. If paid social links are active while organic links barely register, your budget mix may need another look.
Instead of chasing every metric at once, let that engagement data guide where you dig in next and where you may want to scale back.
Keeping reporting accurate and defensible
It’s tempting to let strong click numbers do all the talking, but precision matters. Saying “this drove high engagement” is not the same as saying “this increased revenue,” and that distinction protects your credibility.
It also helps to document the context behind the numbers. A brief note about timing, audience, campaign goals, or format makes reports easier to interpret, especially when someone reviews them weeks afterward or outside the original conversation.
Connecting Bitly Analytics insights to better decisions
Every click and scan tells you something. It shows where interest begins, which channels earn attention, and when momentum builds or fades. By focusing on that connection layer, your team can see how people move from message to action across email, social, SMS, events, print, and beyond.
Bitly Analytics brings that visibility together in one place. You can track clicks and QR Code scans over time, review referrers and geographic patterns, explore landing page analytics, and filter performance across campaigns in dedicated dashboards. Because Bitly connects with CRM and other analytics tools, engagement data can sit alongside downstream outcomes to support a clearer, more complete measurement strategy.
The result is faster optimization, cleaner reporting, and decisions you can stand behind.
If you’re ready to make engagement easier to measure and act on, explore Bitlypricing and find the plan that fits your goals.
FAQs
What is Bitly Analytics?
Bitly Analytics is Bitly’s analytics experience for understanding how people engage with your Bitly Links, Bitly QR Codes, and Bitly Pages. It provides visibility into what’s being clicked or scanned, when activity occurs, and where traffic originates, so teams can see how connections perform across channels before visitors reach a destination.
What metrics can I see in Bitly Analytics?
Bitly Analytics includes engagement metrics such as total clicks and scans, referrers, general location data, device types, and time-based trends. These data points help teams assess channel effectiveness, review placement performance, and recognize patterns like peak engagement windows or high-performing distribution sources.
Can Bitly Analytics track conversions or revenue?
No. Bitly Analytics does not track conversions, purchases, donations, or revenue. Its purpose is to measure engagement at the connection level. Conversion and revenue data are typically captured in web analytics platforms, CRMs, or ecommerce and donation tools, which teams use alongside Bitly to understand full-funnel performance.
Does Bitly Analytics replace Google Analytics or a CRM?
No. Bitly Analytics complements tools like Google Analytics and CRMs rather than replacing them. Bitly provides insight into how people reach your content through links and QR Codes, while analytics platforms and CRMs track what happens afterward, including conversions, form submissions, and customer lifecycle data.
How is Bitly Analytics useful for offline campaigns?
Bitly Analytics makes offline engagement measurable by capturing scans and clicks from QR Codes and short links placed on physical materials like posters, mailers, signage, and event displays. This allows teams to evaluate which offline touchpoints prompt action, compare placements, and make more informed decisions about future offline investments.


