Your brand’s Instagram profile page looks effortless with fresh images, perfectly curated highlights, and a snappy bio. But behind that presentation, there’s a lot of hidden effort—and hidden data just waiting to be tapped.
Most social media managers aren’t using their Instagram analytics to their full potential. Follow our comprehensive guide to help your business get the most value from its Instagram presence.
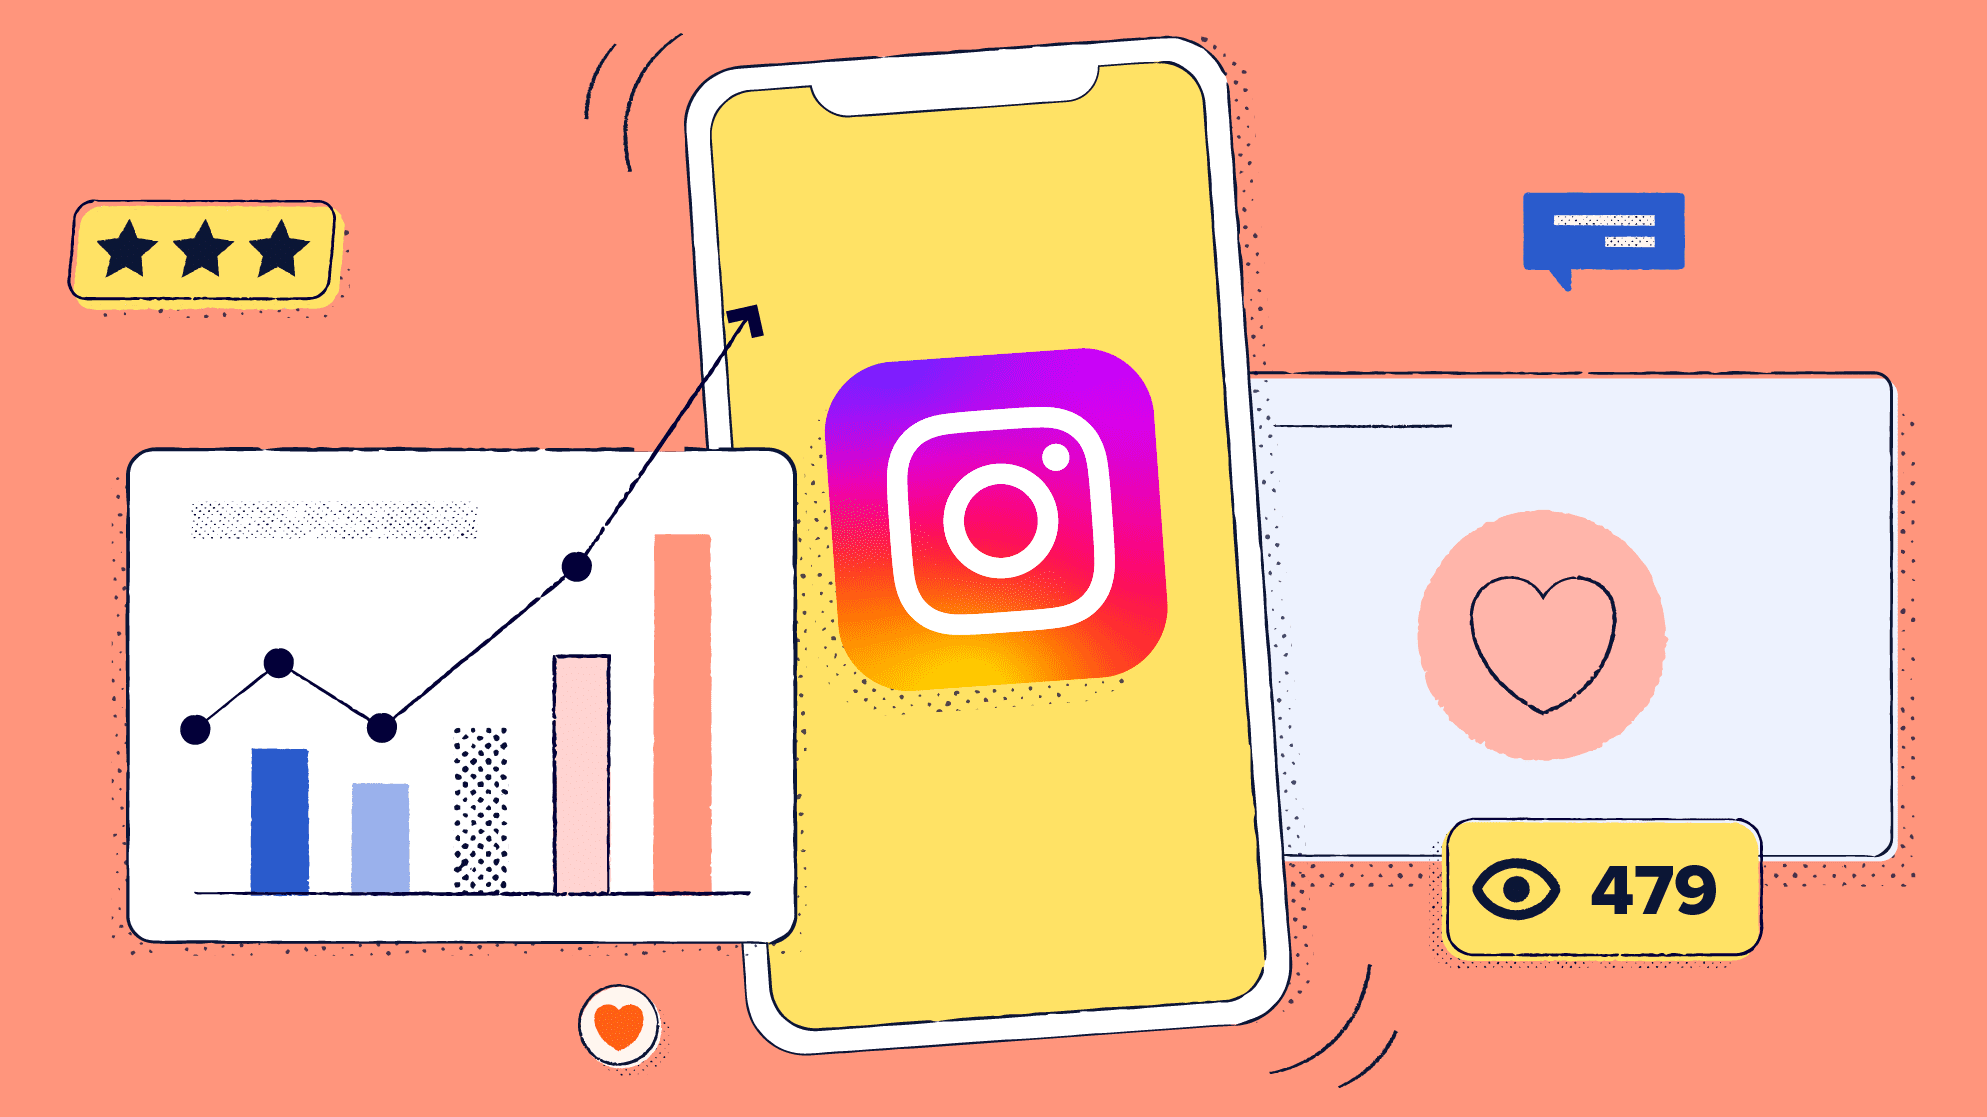
What is Instagram analytics?
The Instagram app serves over two billion monthly active users, and 90% of them follow at least one business on the platform. Facebook data shows that 81% of those surveyed say they use Instagram to research new products, and 83% use it to discover new products.
That makes Instagram non-negotiable for social media managers. If you’re selling anything online, then you need an active presence on Instagram. But with over 200 million active business accounts competing for attention, how can you make your message stand out?
Instagram analytics, also known as Instagram Insights, is an in-app tool that provides statistics about your account and content. Katie McKiever, social media consultant, sums it up: “Instagram Insights unlocks an account’s growth potential. It’s the one definitive place you can point to that will help drive your Instagram and overall social media strategy.”

Katie McKiever, social media consultant.
Instagram offers three types of accounts: personal, business, and creator. Only business and creator accounts have access to Instagram account insights.
Why businesses should care about Instagram analytics
If you care about attracting and retaining customers, then you need Instagram analytics. The challenge for any brand is to break through the billions of posts on Instagram to connect with its target audience.
For Alessandro Bogliari, CEO and co-founder of The Influencer Marketing Factory, a company that doesn’t take advantage of Instagram analytics is losing out. “Every metric can help you understand the effectiveness of an Instagram marketing campaign: number of likes, comments, shares, saves, sticker taps, and Story clicks.”

Alessandro Bogliari, CEO of The Influencer Marketing Factory.
An overview of the main types of Instagram analytics
Instagram analytics starts with an overview of audience demographics, engagement, and reach. There are also individual categories based on content type. You can access per-post information for photos, Stories, Reels, and videos.
For each Instagram Insights section, you can filter and rank content using one or more performance metrics. You can also view data for any custom time period within the last 90 days.
Here’s a detailed breakdown of all the metrics on Instagram Insights.
Instagram account
To access Instagram analytics, go to your profile and tap Insights.
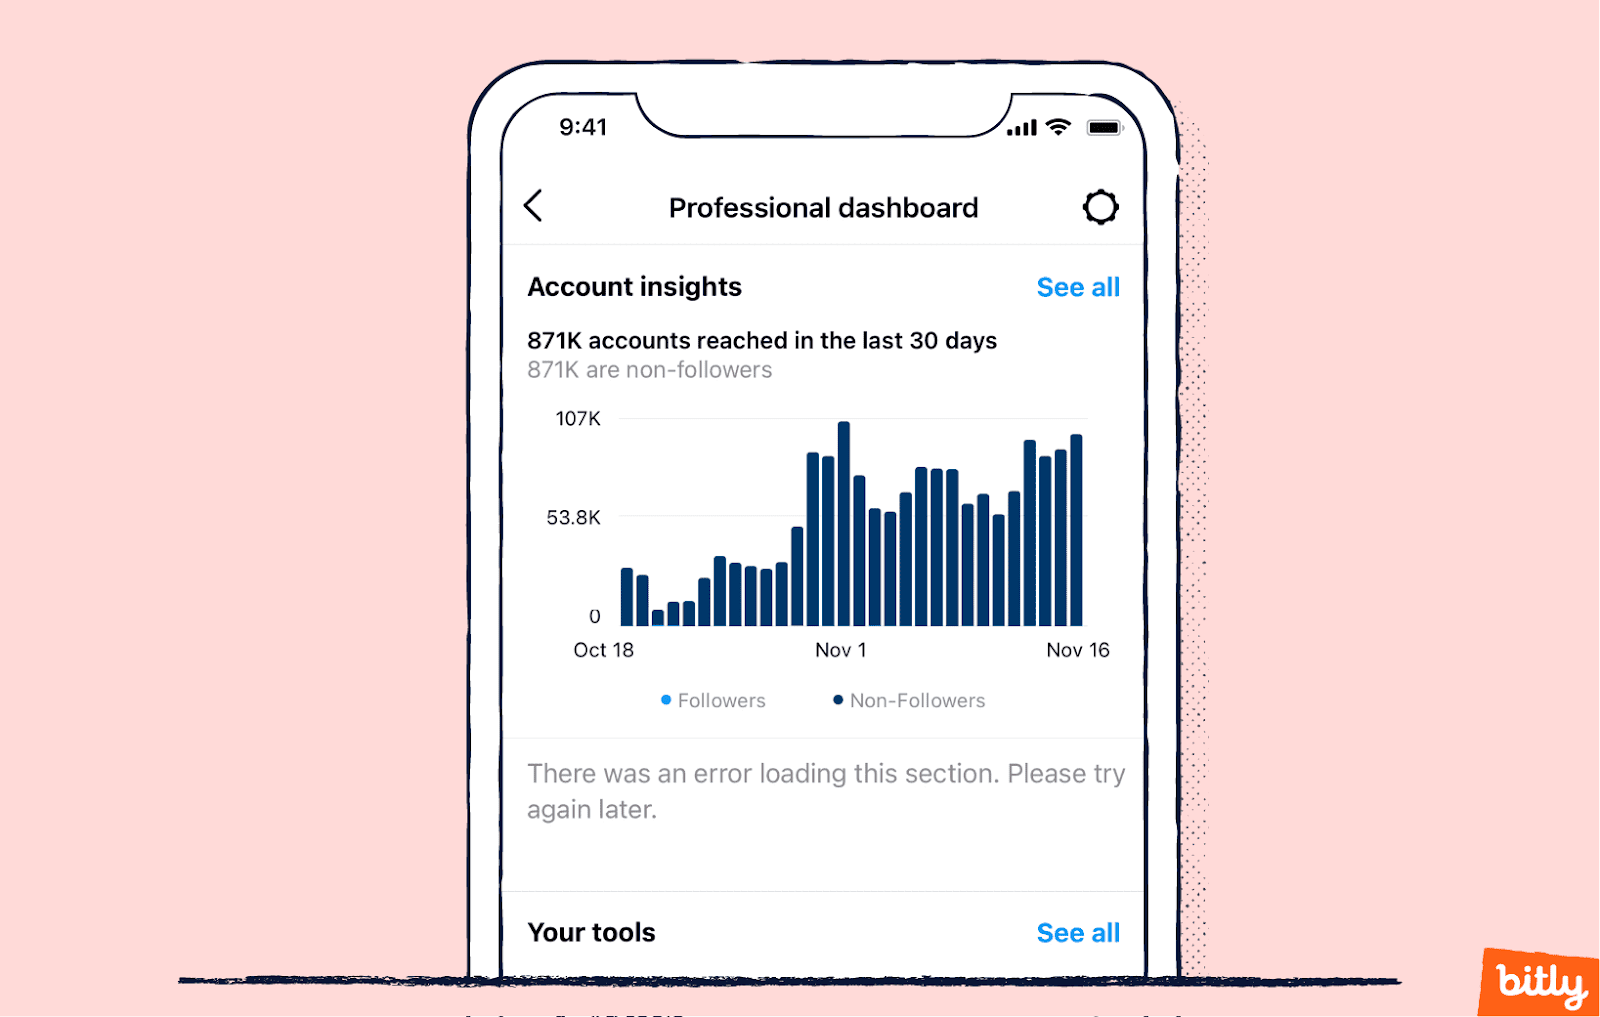
First, you’ll see overall account analytics. These compile an account-level perspective to show how your content performs in general.
To access the following metrics, you must have at least 100 followers.
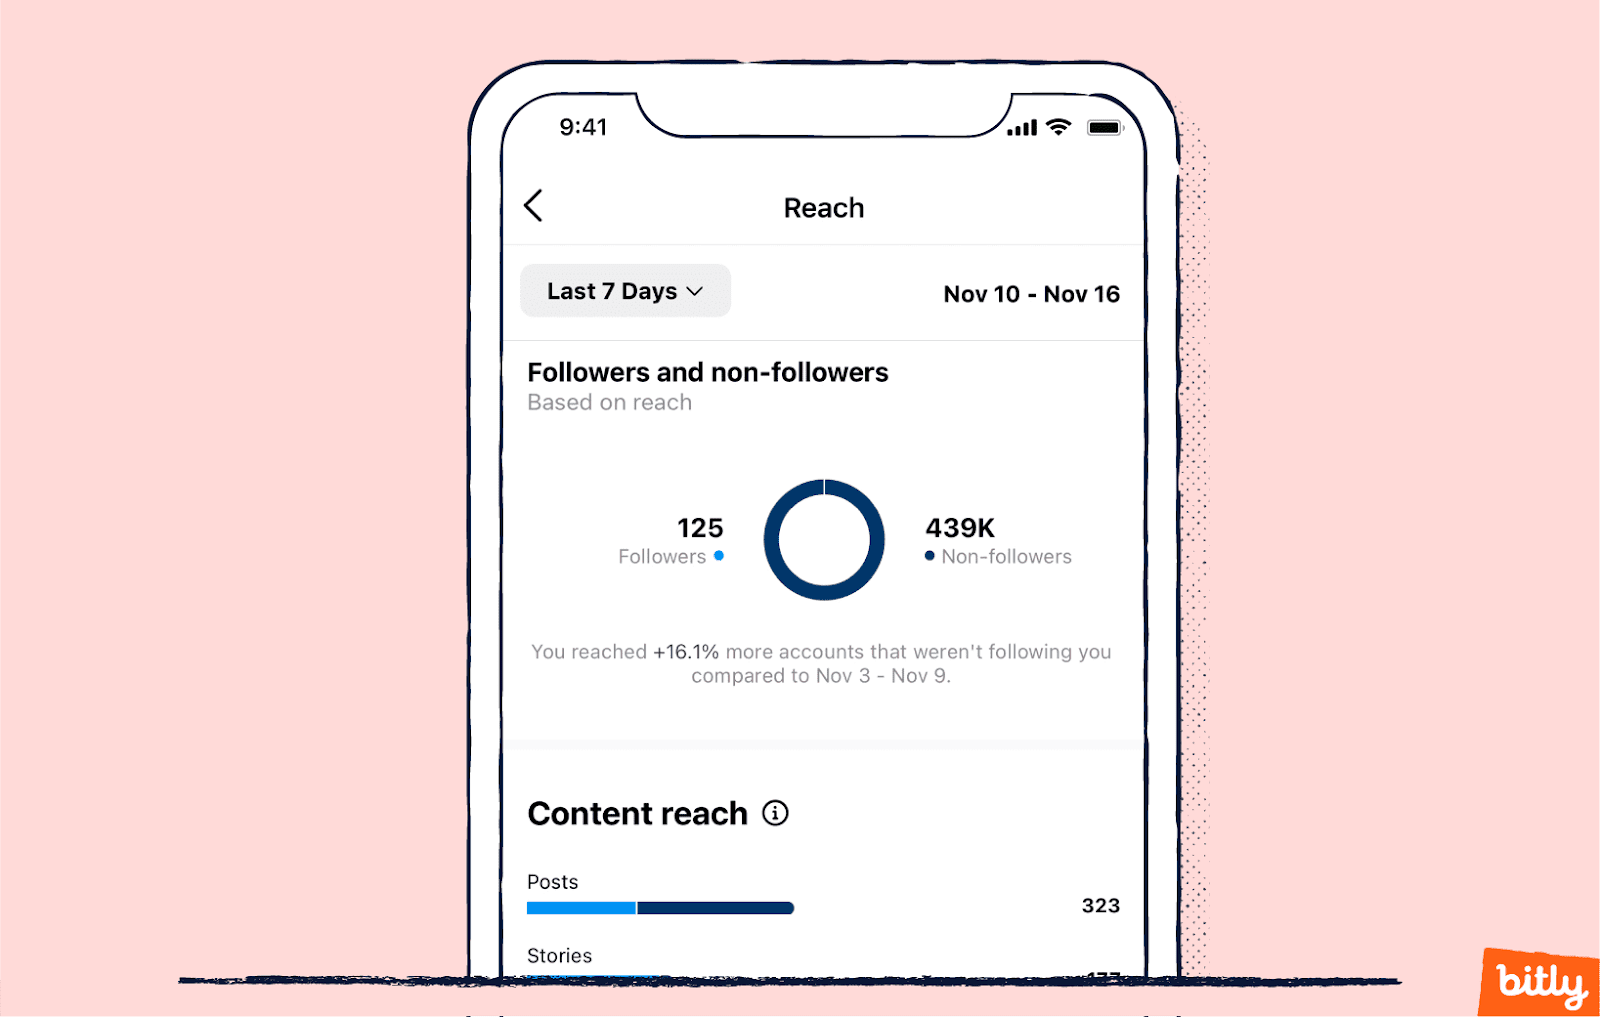
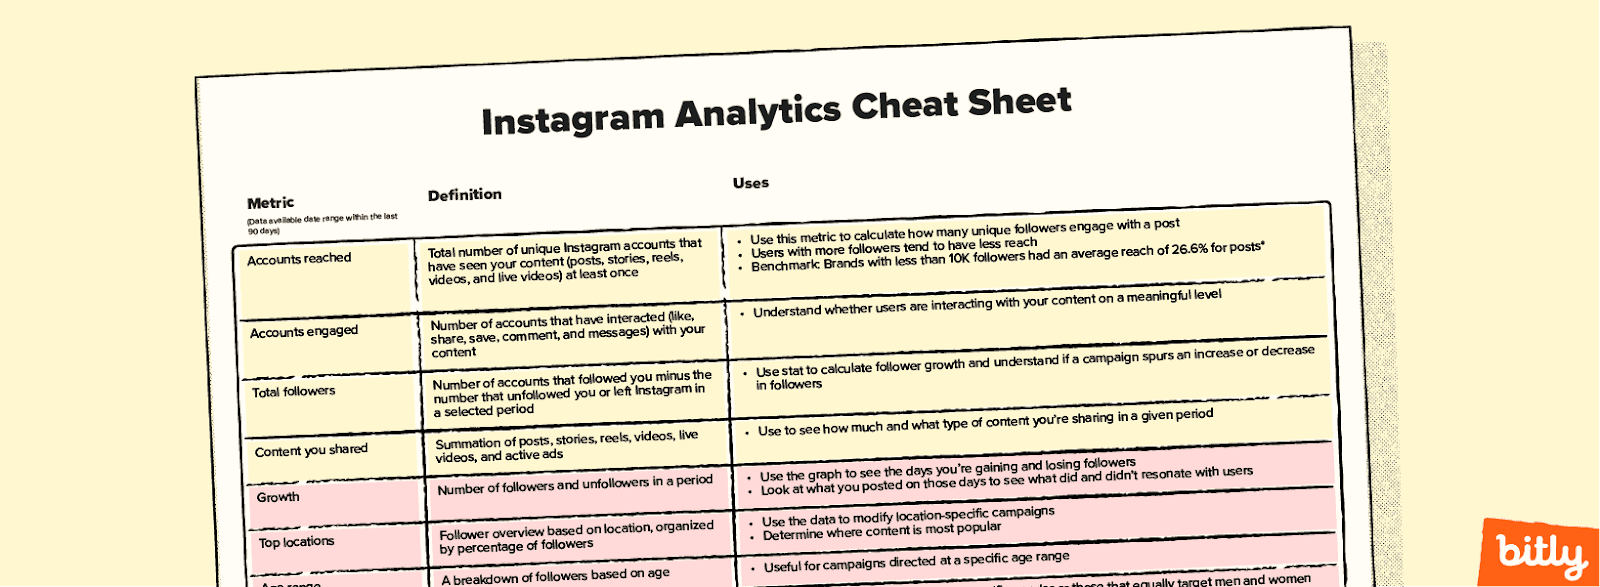
- Accounts reached
This is the total number of unique Instagram accounts that have seen your content at least once. Try to bring your reach count as close to your follower count as possible. When reach increases, it means more people have viewed your content. - Accounts engaged
This shows how many users interact with your content. Interactions include liking, saving, commenting, sharing, or messaging about your content. Instagram’s algorithm prioritizes content that gets a lot of interactions, so you should aim to increase engagement on Instagram wherever possible. - Total followers
This displays the number of Instagram followers you currently have. - Content you shared
This is the total number of posts you’ve shared since switching to a business or creator account. - Post interactions
This is the number of overall interactions, which Instagram calculates by subtracting any unlikes, unsaves, and deleted comments from the number of interactions. You can access this metric by tapping on Accounts Engaged and scrolling to Content Interactions. - Instagram profile insights
This is data about how many users visited your profile (including repeat visitors) and how they interacted with it. You can find these metrics at the bottom of the Reach page.
Instagram audience
On the main Insights Overview page, tap Total followers to access insights about your audience.
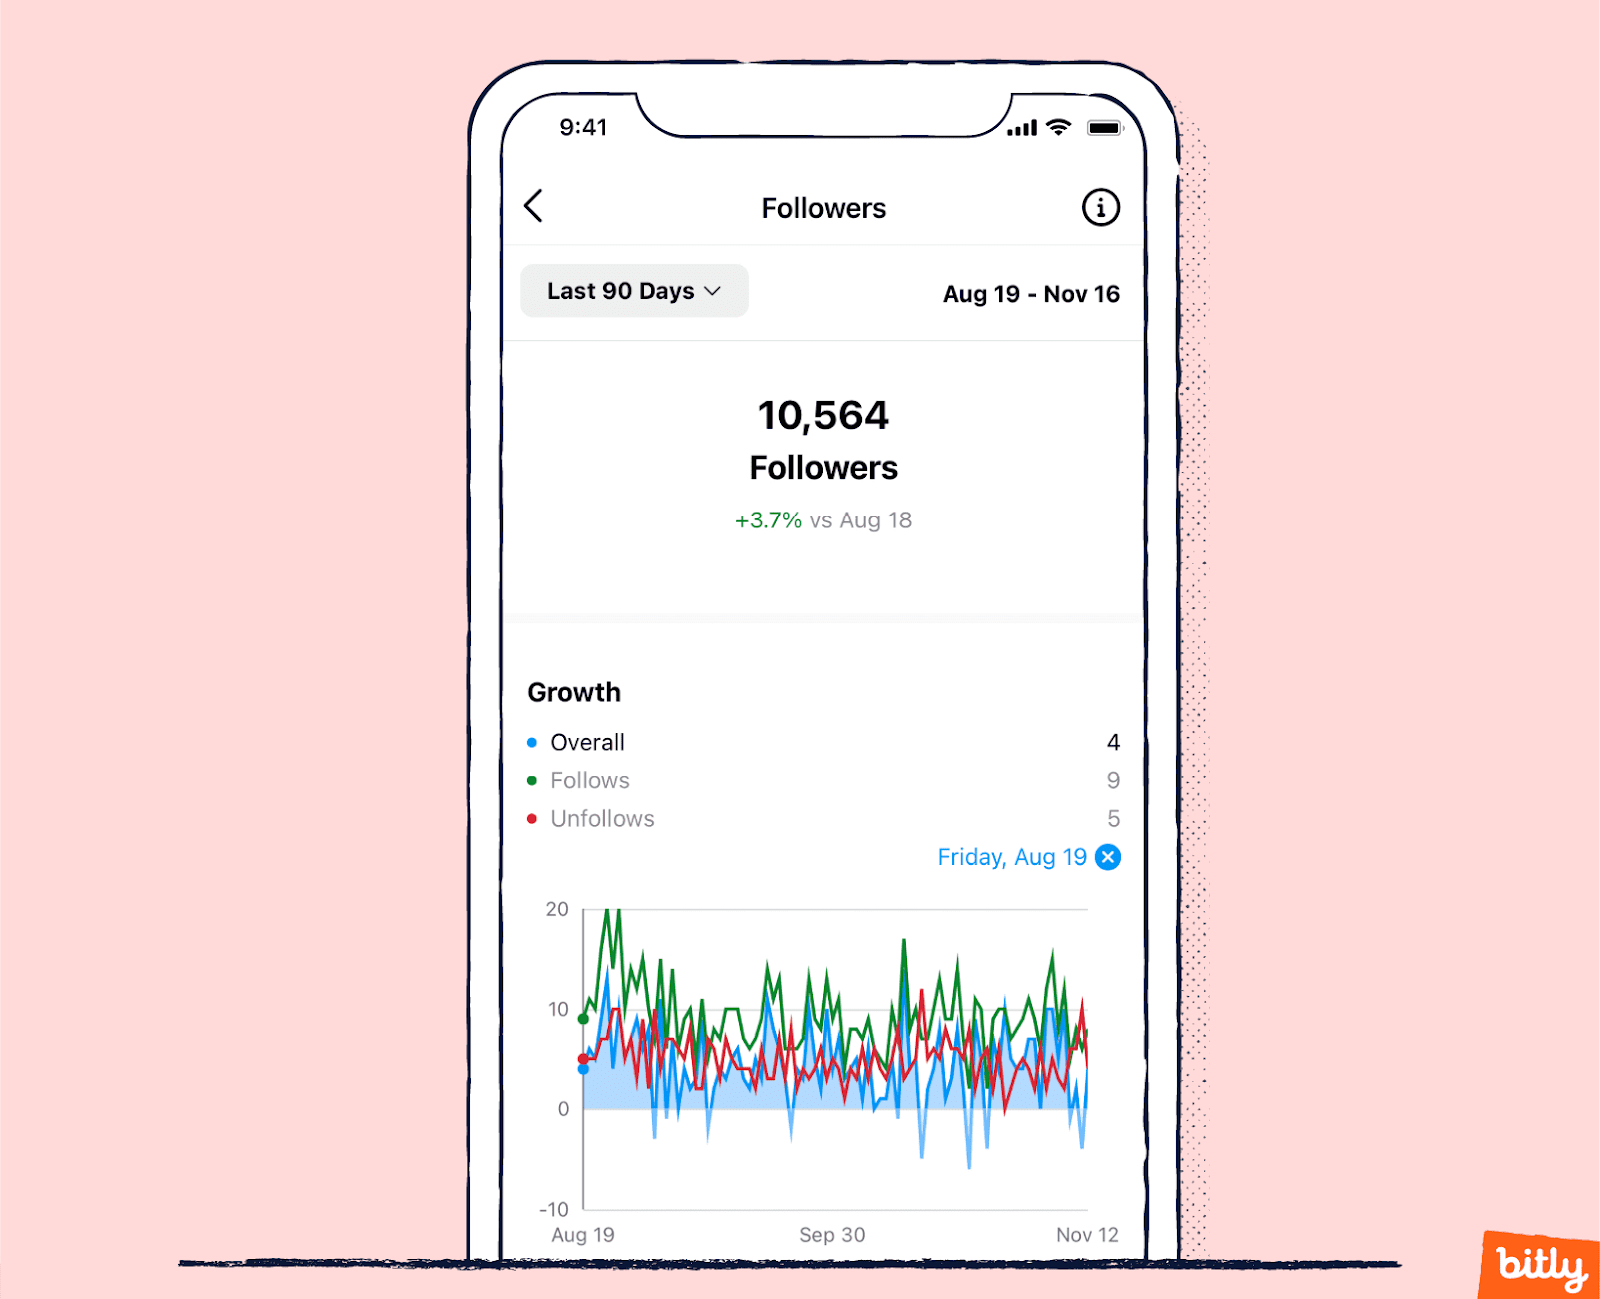
- Follower growth
Instagram measures the number of accounts that followed you, minus those that unfollowed you or left Instagram during a selected period. This metric helps track the increase in your profile’s visibility. You can also determine if a specific campaign increased followers.
- Top locations
Here, you can see a list of followers by location, organized by percentage in each area. Instagram provides the top five cities and countries, allowing you to tailor a marketing campaign to a specific location. - Age range
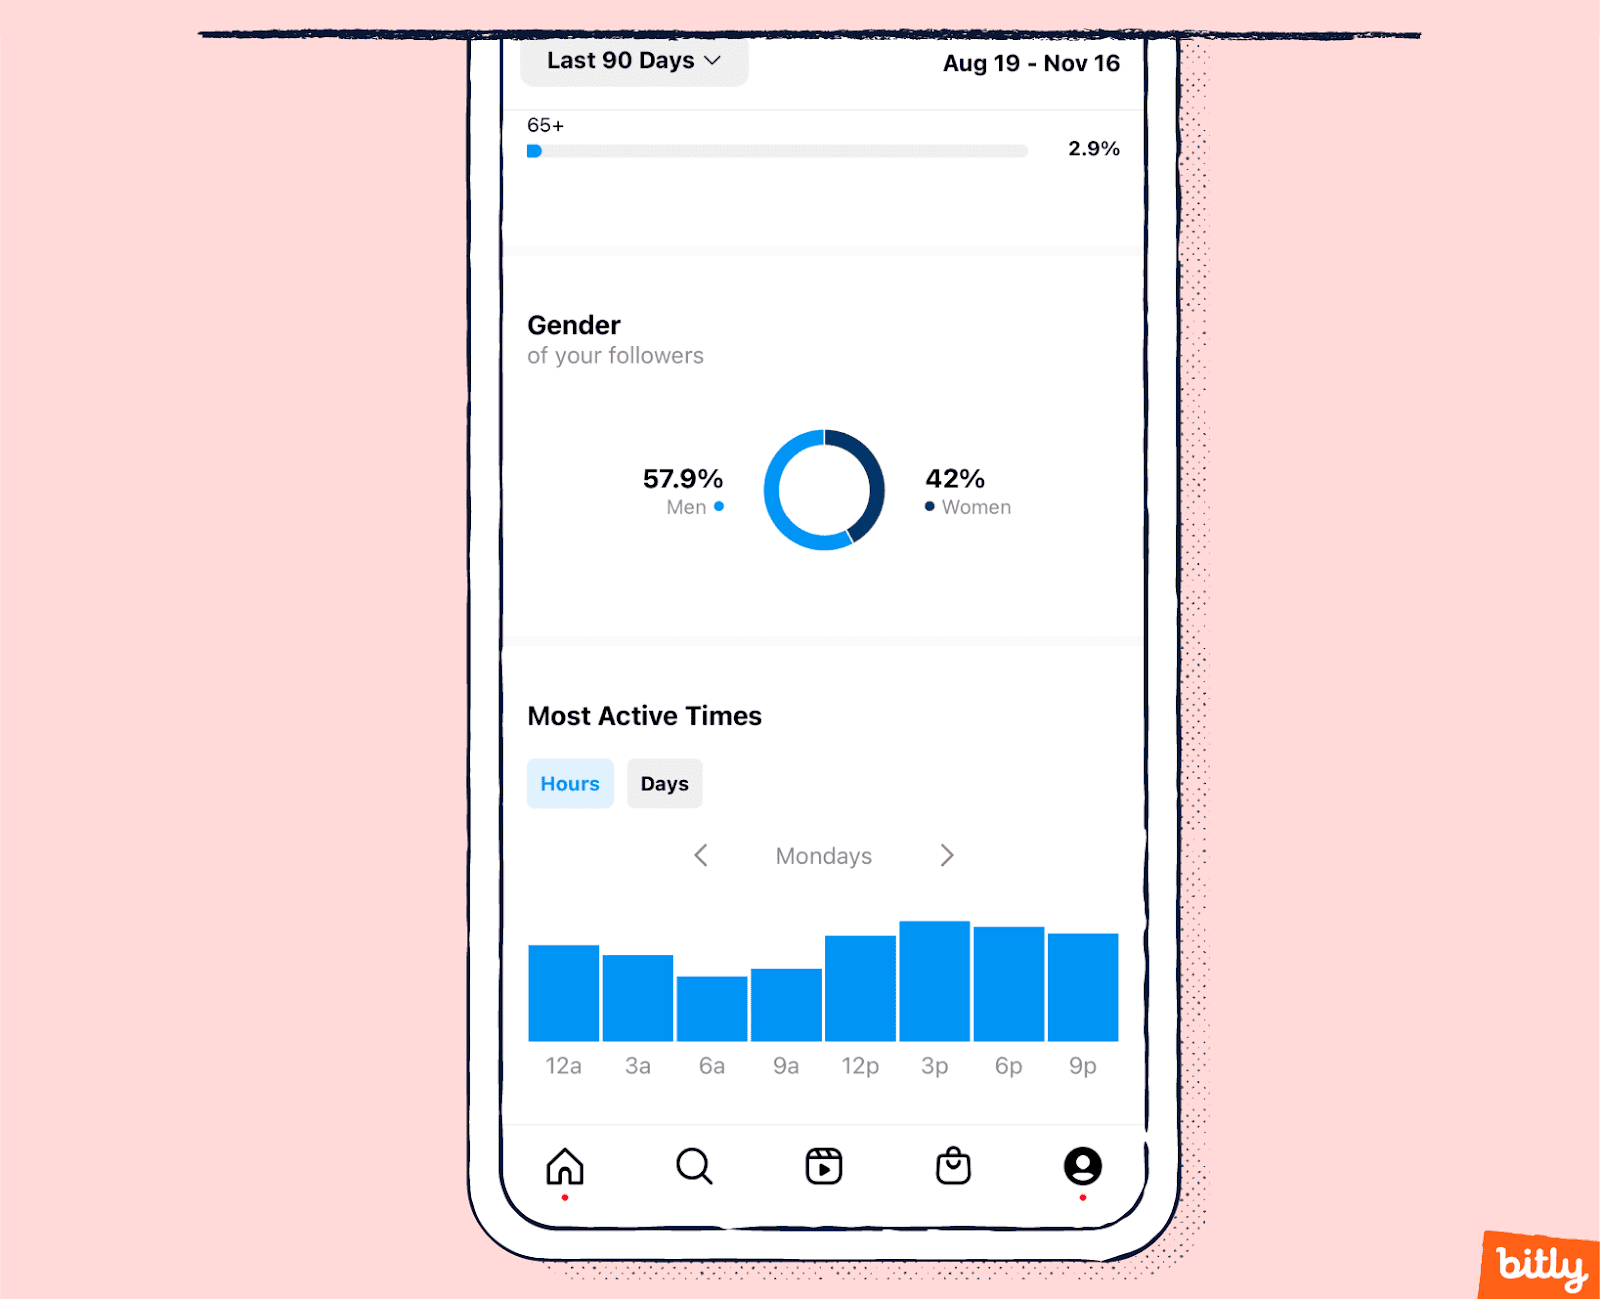
This metric shows your audience divided into different age groups by percentage. It’s especially helpful for checking if a campaign targeted to a specific age group is working.
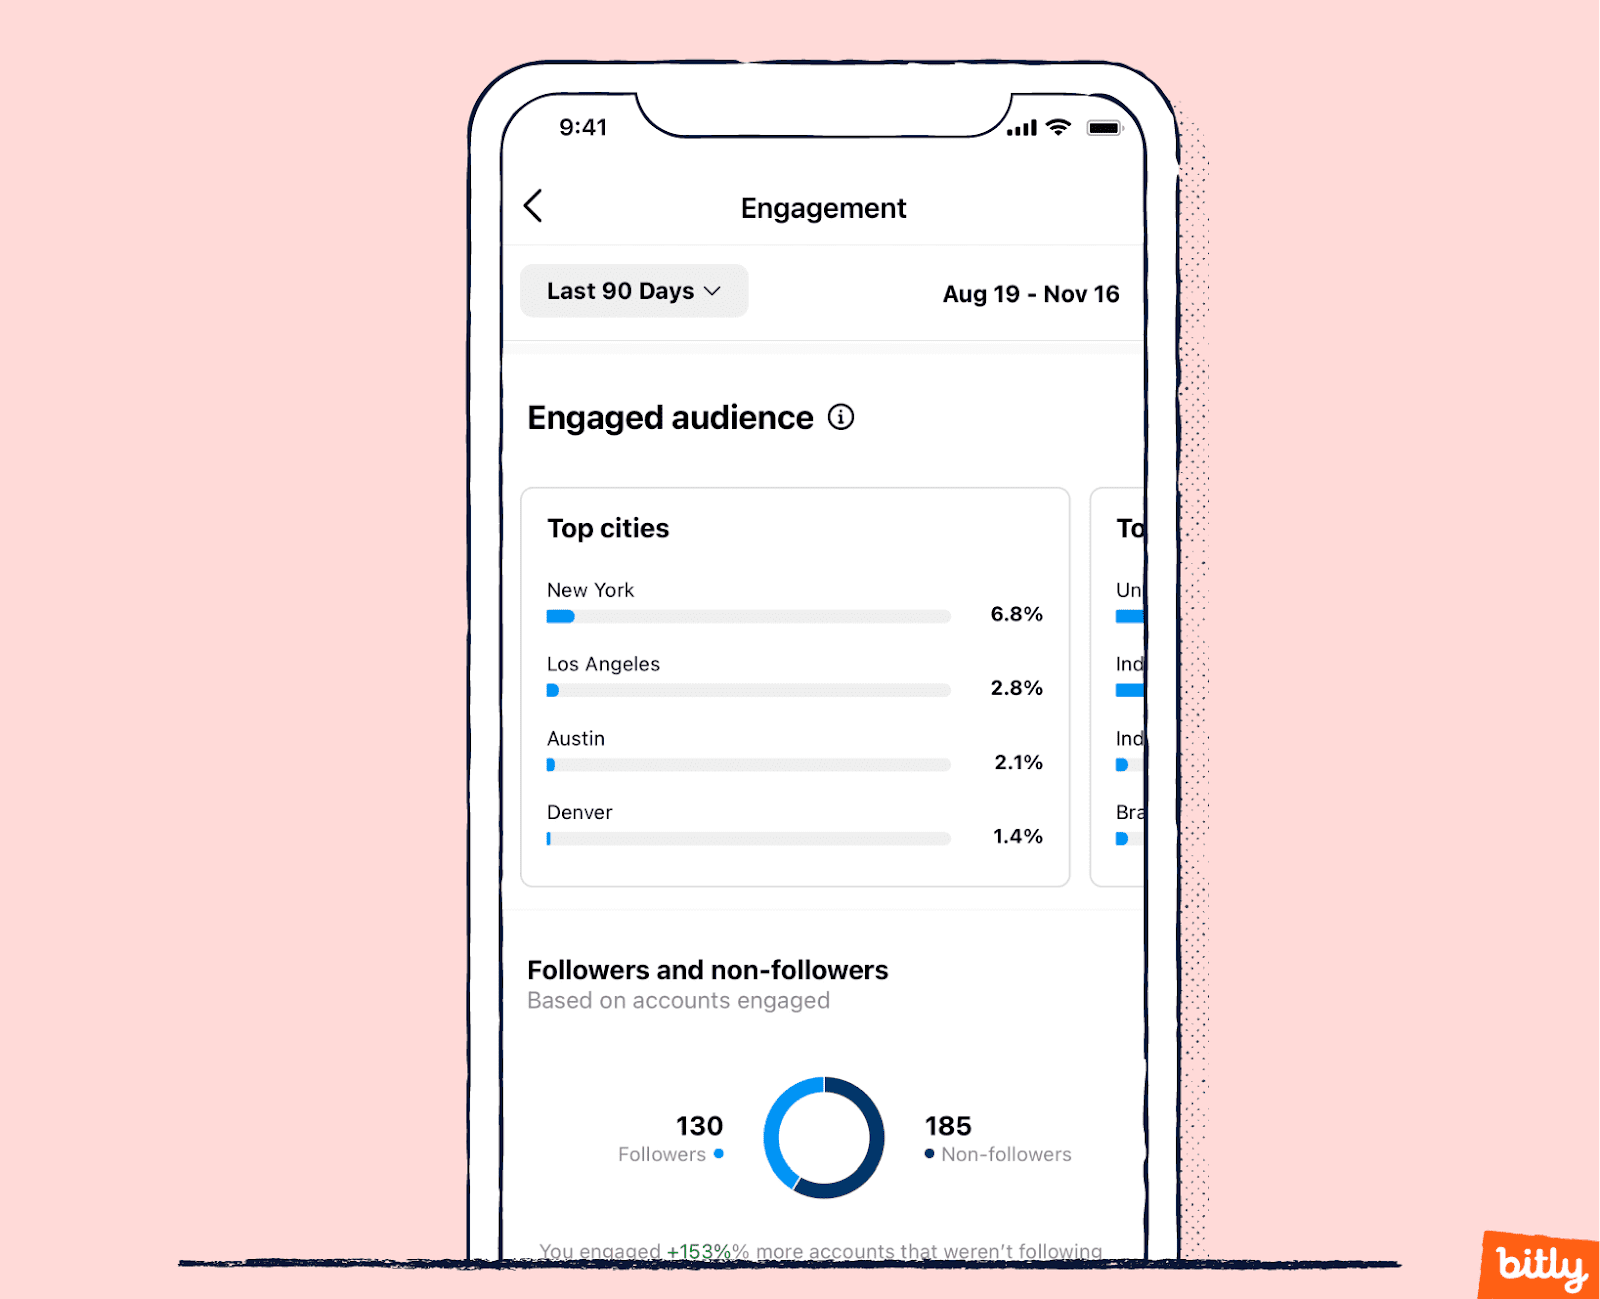
- Gender
This is a breakdown of your followers based on gender. Like other demographic data, this statistic helps brands where primarily one gender uses its products or services. - Most active times
Instagram displays each hour of the day in a bar graph that tracks the number of users on your profile. You can also toggle to Days to check which days of the week see the most activity. Use this information to coordinate your posting timeframes.
Instagram posts
To see individual post statistics, tap on a post you’ve created and tap View insights in the drop-down menu.
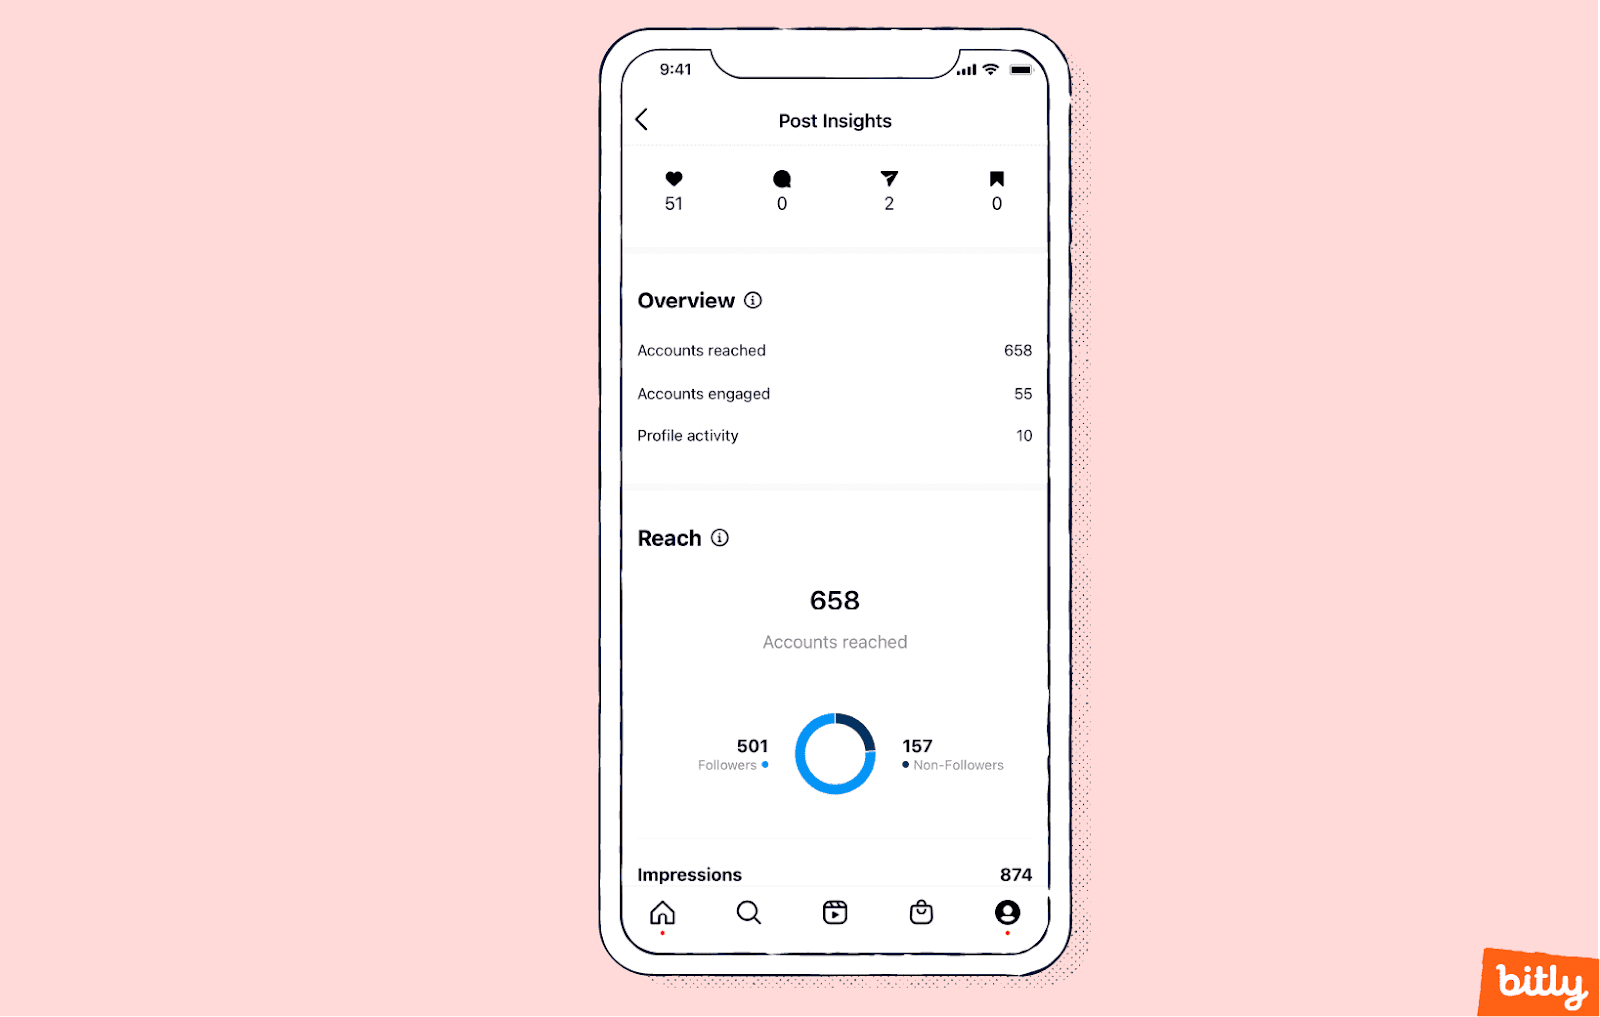
- Reach
This estimates how many unique accounts have seen the post at least once, splitting them into followers and non-followers. - Impressions
This is the number of times your post appeared on a screen. Impressions include repeat views and can be broken down into views from the main feed, hashtags, and your profile. - Post interactions
This is a simple count of likes, comments, shares, and saves of the post. - Profile activity
This shows how many users visited and interacted with your profile after seeing a post. You can break profile activity down into how many profile visits and follows you gained from the post. - Ad
If you paid to boost the post, this section shows data regarding how many people it reached.
How to check Instagram metrics and analytics
You can also read Instagram analytics categorized by different post types.
Starting in the overall insights menu, select Content you shared and then choose a specific content type. The next screen will display in-depth stats for the content you shared during a specific period.
Note: You’ll only see Instagram analytics tools for content posted after you’ve converted to an Instagram business or creator account.
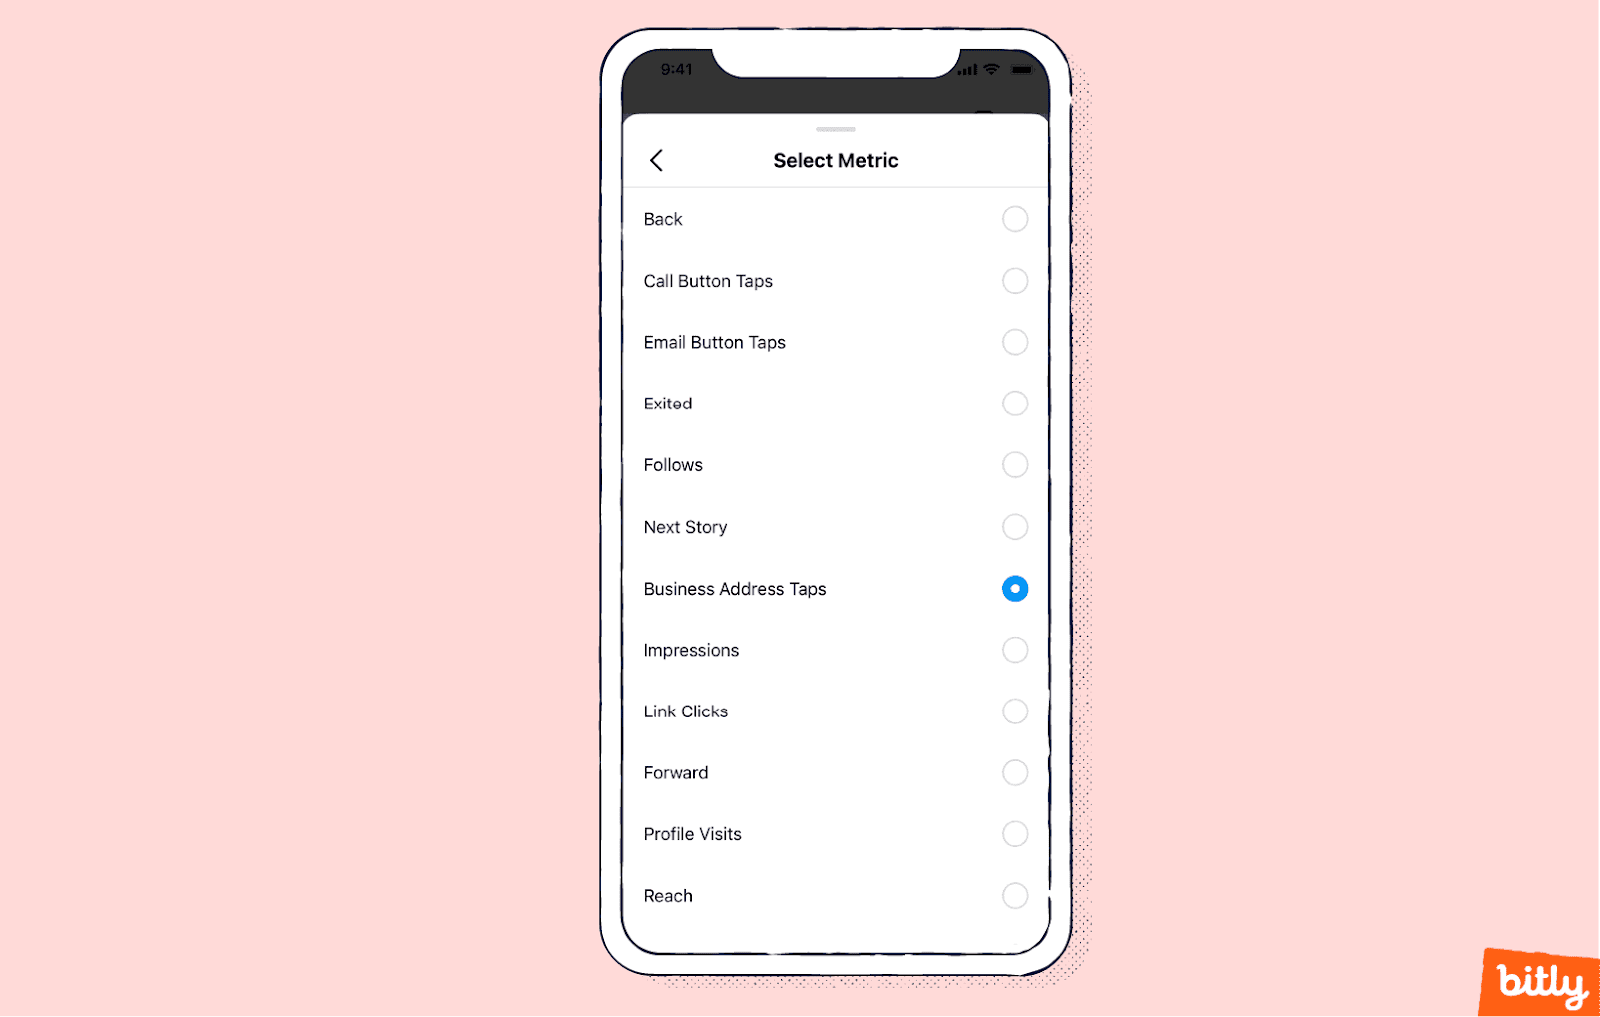
Instagram Stories
On the Stories Insights page, you can tap the top left button to filter for a specific metric.
These are all the metrics you can view for a Story:
- Follows: This shows how many accounts followed you after engaging with a Story.
- Profile visits: This is the number of times users visited your profile after viewing a Story.
- Taps: This number includes taps on the profile links for your website and business address and the buttons to call, email, or text your business.
- Impressions: This is the number of times your Story appeared on a screen, including repeat views.
- Reach: This is the number of unique accounts that have seen a Story at least once. Reach does not include multiple views of your post from the same account.
- Story interaction: You can use this data to learn if your Story engaged viewers.
- Replies: This is the number of direct messages users sent you after viewing your Story.
- Shares: This shows the number of times users shared your Story with others.
- Link clicks: Business users can add links to their Instagram Stories. This number measures how many people tapped on the link when viewing the Story in the 24 hours that the Story was visible.
- Story navigation: Instagram tracks the number of users who exit before the clip finishes, swipe onto the next Story, tap to view more Stories from you, or tap backward to re-watch content.
Instagram Reels
On your profile page, tap the Reel you’d like to view statistics for and tap View Insights. You can also tap Reels under Content you shared on the Insights Overview.
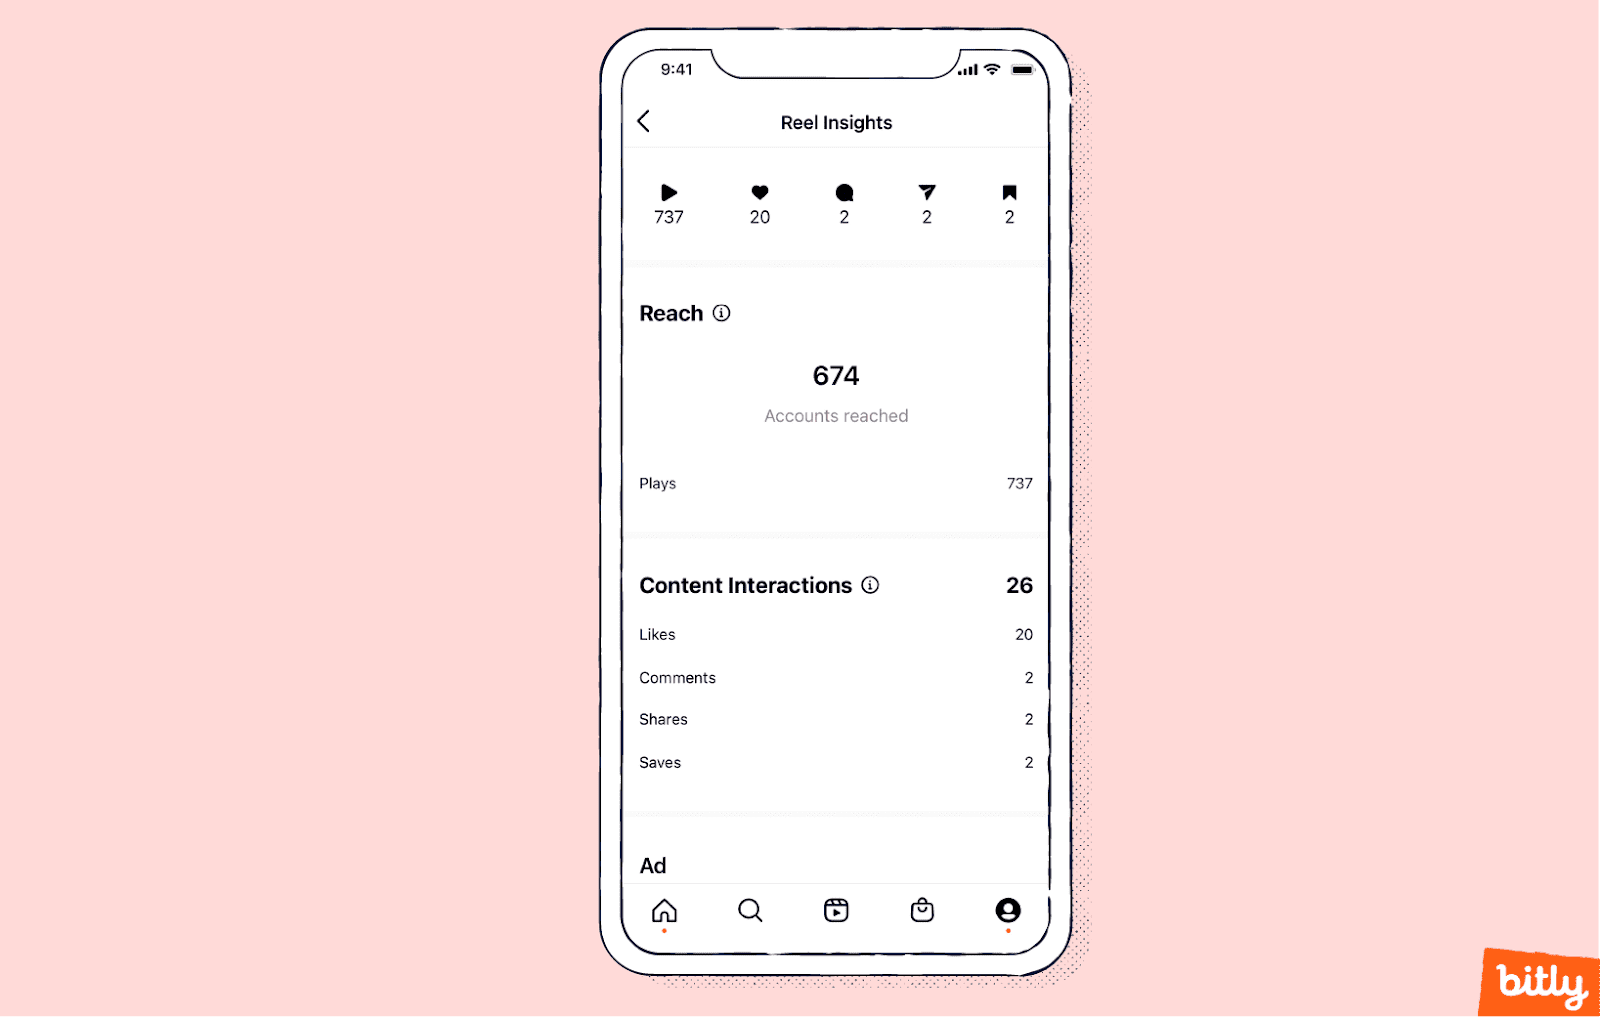
Here’s an overview of the analytics available for Reels:
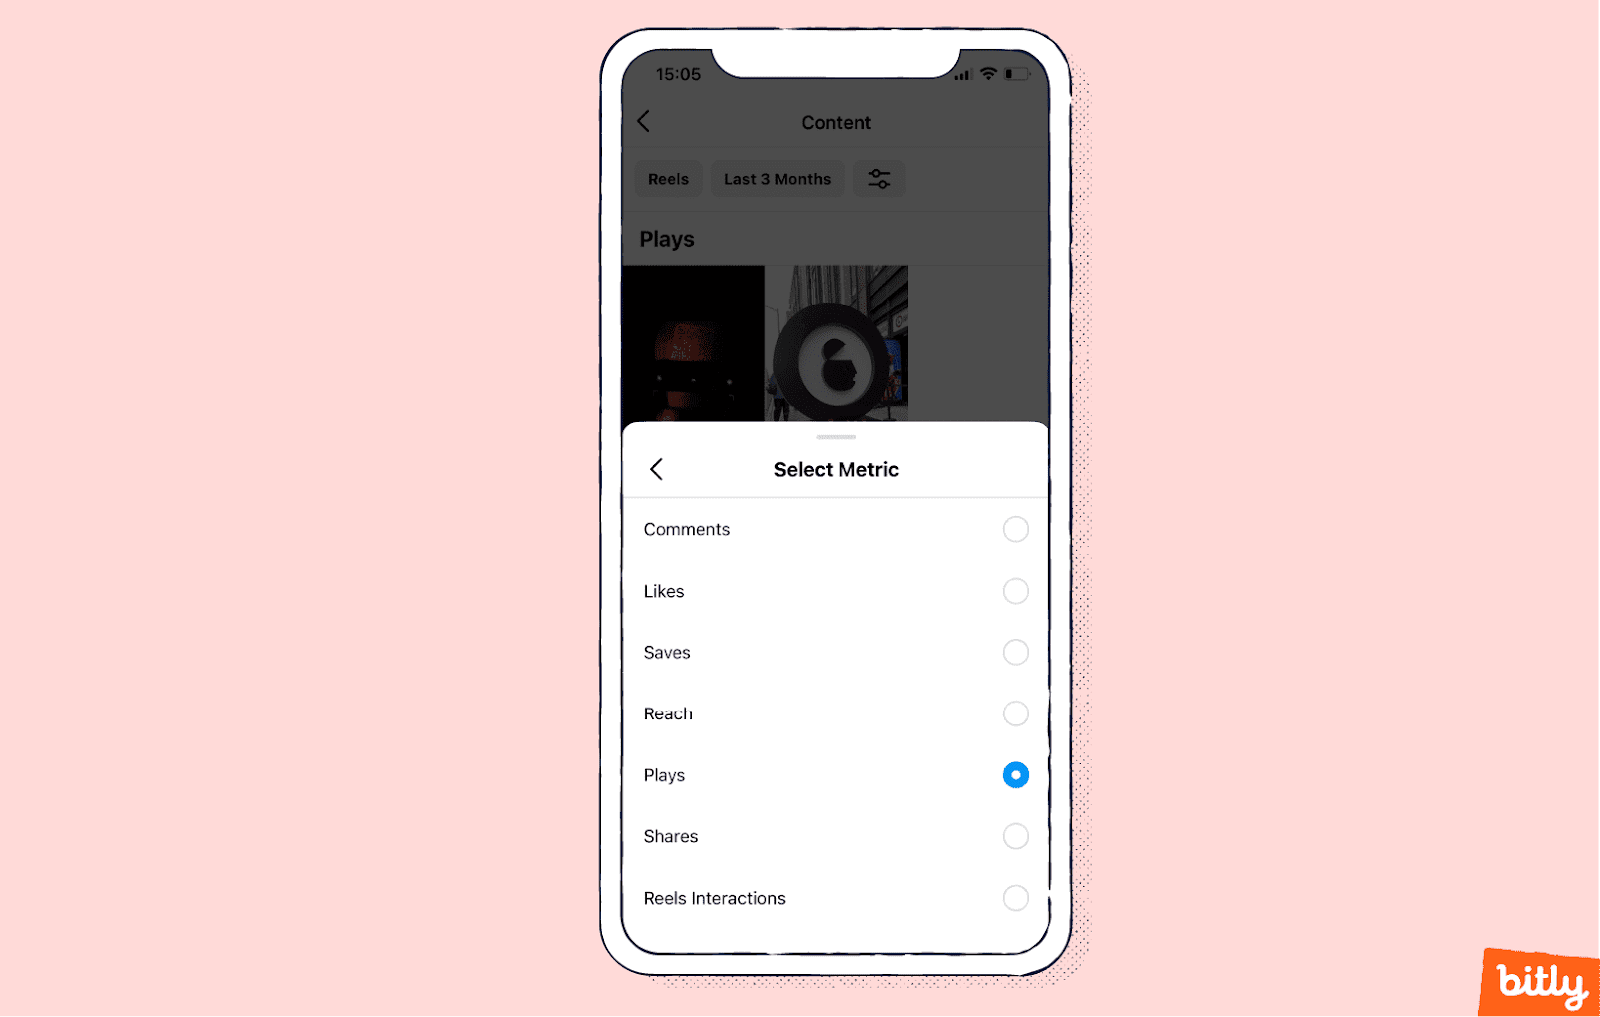
- Reach: How many unique Instagram users saw the Reel at least once.
- Plays: The number of times users played the Reel, including repeat views.
- Reels interactions: How many users like, comment, share, and save the Reel.
Instagram video
Access video analytics from the Insights Overview page by tapping Videos under Content you shared.
Instagram videos have similar metrics to Instagram Stories, including taps, follows, profile visits, impressions, reach, likes, comments, and saves. Like Reels, they measure video views and interactions.
There are also a few extra metrics for Instagram videos:
- Average watch time: The average amount of time viewers watch the video. Use this to identify when users drop off from your content.
- Video views: How many times users viewed the video.
- Video interactions: How many times people interacted with your video in the form of shares, comments, saves, and likes. You can also view these measurements individually.
Instagram Shopping
To enable Instagram Shopping, you need to meet Instagram’s eligibility criteria and have a professional profile connected to your Facebook page.
If you enable Instagram Shopping, you’ll have access to two more metrics about your shopping platform.
- Product views: The total number of times people tapped a product tag to view a product page.
- Product button clicks: The number of times people tapped the purchase button on a product page.
Instagram Live
You can access data about Live videos by tapping Live, which is under Content you shared on the Insights Overview page.
In addition to data on comments and shares, Instagram offers the following Live metrics:
- Accounts reached: The total number of users who viewed your Instagram Live streams.
- Peak concurrent viewers: The number of viewers that viewed the stream at its busiest point. Peaks can be due to various factors, such as specific times of day or the content itself.
Check out our free downloadable cheat sheet for a quick, at-a-glance summary of key Instagram Insights, how to use them, and some benchmark statistics.
Instagram analytics best practices
Though there’s plenty of data in your account, that alone doesn’t help you optimize your Instagram strategy.
Here’s how to use Instagram insights to get the best results:
- Monitor changes in follower count: Follower count is a blunt metric, but it’s a good way to measure the overall health of your Instagram profile. If the number of followers suddenly rises or falls, you should find out why.
- Check content regularly: Social media consultant McKiever advises, “Every brand should be in the habit of checking its analytics monthly to see growth and opportunities.”
- Use audience insights to tailor content: Don’t rely solely on post metrics to measure your performance. You might get stacks of likes, comments, and saves, but they’re not worth much if they aren’t from your target audience. Keep an eye on your audience insights, and create content that will appeal to your target followers.
- Use a spreadsheet and be organized: “Instagram Insights should be used as a part of a consistent optimization loop: Post new content, test it, identify high performing content, make similar content, and continue testing,” says Bogliari.
- Leverage Instagram’s “sort” feature: McKiever advises companies to “sort by follows to see which posts got your brand the most followers. Then, you can recreate similar posts to grow faster.”
- Track advanced interaction data with Bitly: Instagram offers limited metrics about link clicks. However, you can add UTM parameters and create custom links with Bitly to discover more about how, when, and where people tap through to your website.
How to benchmark your Instagram analytics
You can benchmark your Instagram analytics by evaluating your best- and worst-performing content. That sets a baseline for your own work. But it can also be useful to benchmark your performance against your industry and competitors.
Here are some strategies to use for internal and external benchmarking:
- Internal benchmarking: In internal benchmarking, creators compare analytics across their own posts. Use what you learn from the comparison to identify themes about what viewers like.
“For your overall account, emphasize total followers, accounts reached, and top posts, Stories, and Reels,” says McKiever. “For individual posts, prioritize follows, profile visits, website taps, and reach.”
- External benchmarking: “Instagram native analytics … only show you information on your [own] content,” says Brendan Kane, author of the best-seller One Million Followers and managing partner at Hook Point. “But what if you want to become better than yourself?”

Brendan Kane, managing partner at Hook Point.
Not all of your competitors’ analytics data will be available to you. Still, you can look at views, likes, shares, and comments and check out what types of content your competitors produce.
What about exporting Instagram analytics reporting data?
You can export Instagram data to an Excel spreadsheet, share it with a social media consultant, or invest in an analytics dashboard from an external company.
By combining multiple metrics and adding more calculations to your reports, you can gain a more nuanced understanding of your performance.
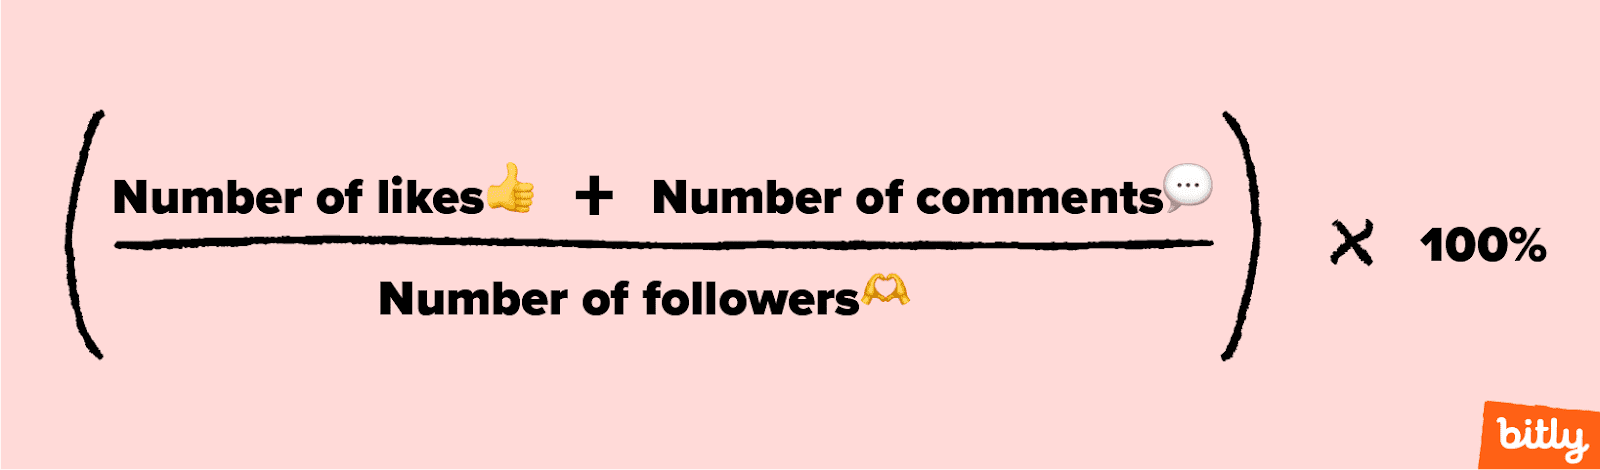
For example, you can find out the engagement rate per post by taking the number of interactions per post and dividing it by your reach or number of followers.
You can gather more data about how your Instagram performance converts into sales by adding UTM parameters to the links you share on the social network.
Use a service like Bitly to create short Instagram URLs that are optimized for the platform and utilize their campaign and tracking data features.
View insights on your business account and track Instagram engagement rates with Bitly
Instagram is a must-have asset for any business. But even with the platform’s built-in insights, it’s getting harder to measure the impact of social media marketing on your sales.
“For every dollar invested in social media, a business should know how many dollars they are receiving in return,” Bogliari says.
Bitly helps you create trackable, shareable links to follow your customers on their journey from Instagram to checkout. With more data, you can refine your digital marketing strategy for an even better return on investment.
Get a competitive edge when you enhance your Instagram Analytics with Bitly.


